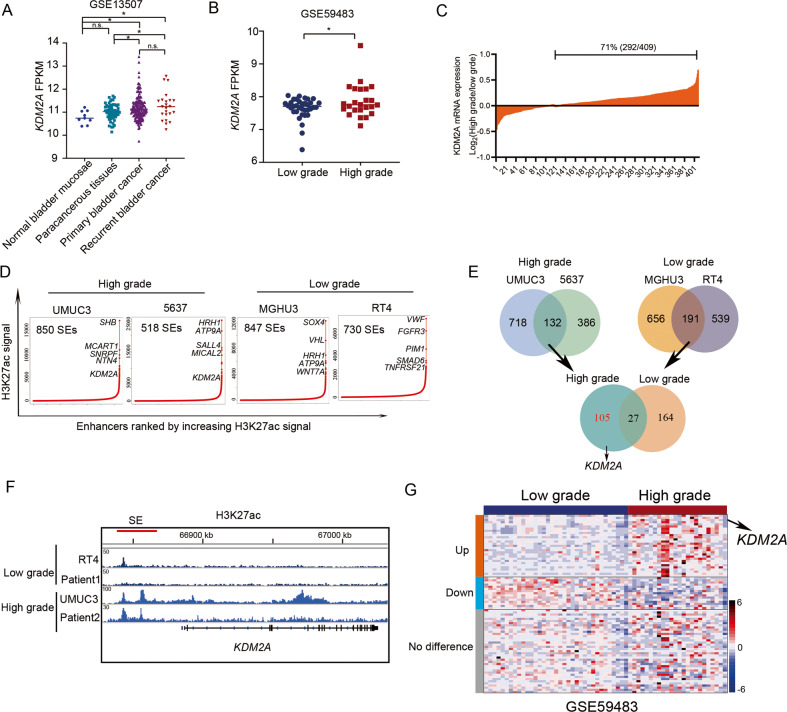
Fig. 2. High-expression level of KDM2A was related with H3K27ac enrichment in high-grade bladder cancer.
A Analysis of KDM2A expression level in bladder cancer tissues and normal bladder tissues in GEO database (GSE13507). B Analysis of KDM2A expression level in high-grade and low-grade bladder cancer in GEO database (GSE59483). C Compared with low-grade bladder cancer, 71% of patients with high-grade bladder cancer had upregulated expression of KDM2A in TCGA. D Enhancers were ranked by increasing H3K27ac signal in high-grade (UMUC3, 5637) and low-grade (MGHU3, RT4) bladder cancer cells. The population above the inflection point of the curve are defined as SEs. The number of SEs and examples of genes associated with SEs are shown for each sample. E Venn diagrams depicting the integrative analysis of SE-associated genes between the high-grade and low-grade bladder cancer cells. F H3K27ac ChIP-seq peaks at the KDM2A loci in bladder cancer cells and samples. G Heatmap depicts the expression of 105 SE-associated genes specific to high-grade in bladder cancer samples (GSE59483). *P < 0.05; **P < 0.01; ***P < 0.001 is based on the Student’s t test. All results are from more than three independent experiments. Values are mean ± SD.

