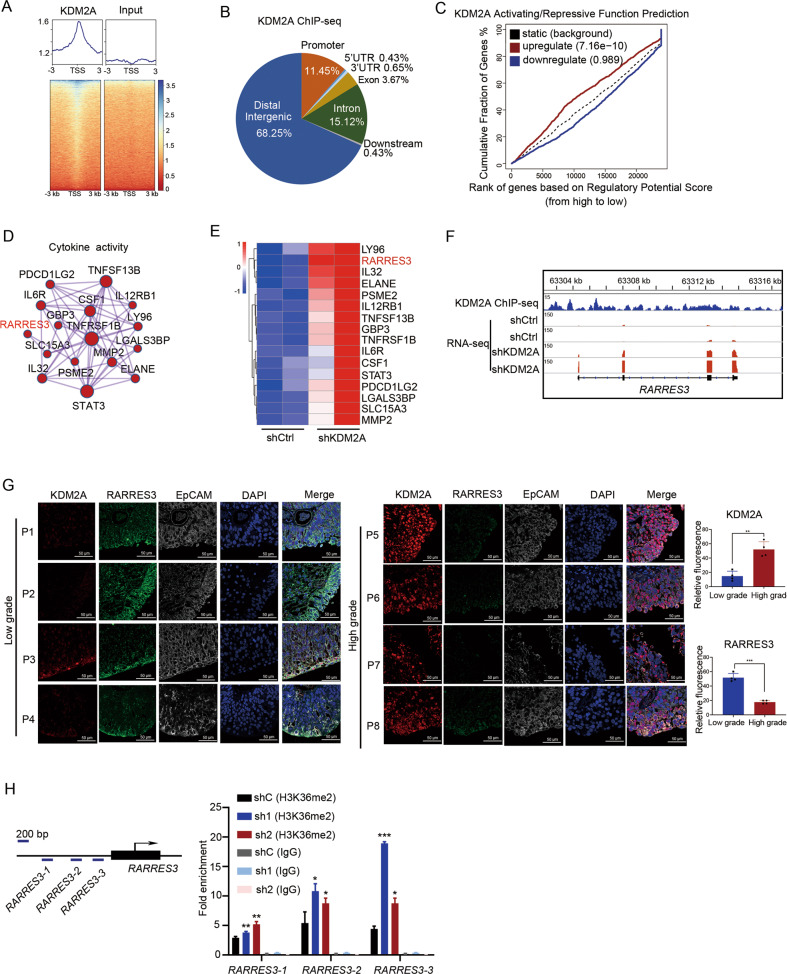
Fig. 4. KDM2A binds and modulates tumor suppressor RARRES3.
A Heatmap showed occupancy for KDM2A across the genome in UMUC3 cells. B Genome-wide distribution of KDM2A ChIP-seq peaks in UMUC3 cells. C Cumulative distribution curve shows KDM2A activating or repressing effects. Differential genes obtained from RNA-seq after KDM2A KD were divided into three groups: upregulated, downregulated, and unchanged according to the expression pattern. The corresponding genes of KDM2A ChIP-seq were sorted from high to low according to regulatory potential score, and the cumulative distribution curves of upregulated, downregulated, and invariant genes were made. D GO terms of upregulated genes that KDM2A target directly. E Heatmap showed the ranking of upregulated cytokine activity genes upon KDM2A KD. F Genome browser tracks of KDM2A ChIP-seq data and RNA-seq data in RARRES3 gene loci. G The protein level of KDM2A, RARRES3, and EpCAM (the biomarker of bladder cancer) by immunofluorescence staining assays. H ChIP-qPCR showed the H3K36me2 modification of RARRES3 promoter upon KDM2A KD. *P < 0.05; **P < 0.01; ***P < 0.001 is based on the Student’s t test. All results are from more than three independent experiments. Values are mean ± SD.

