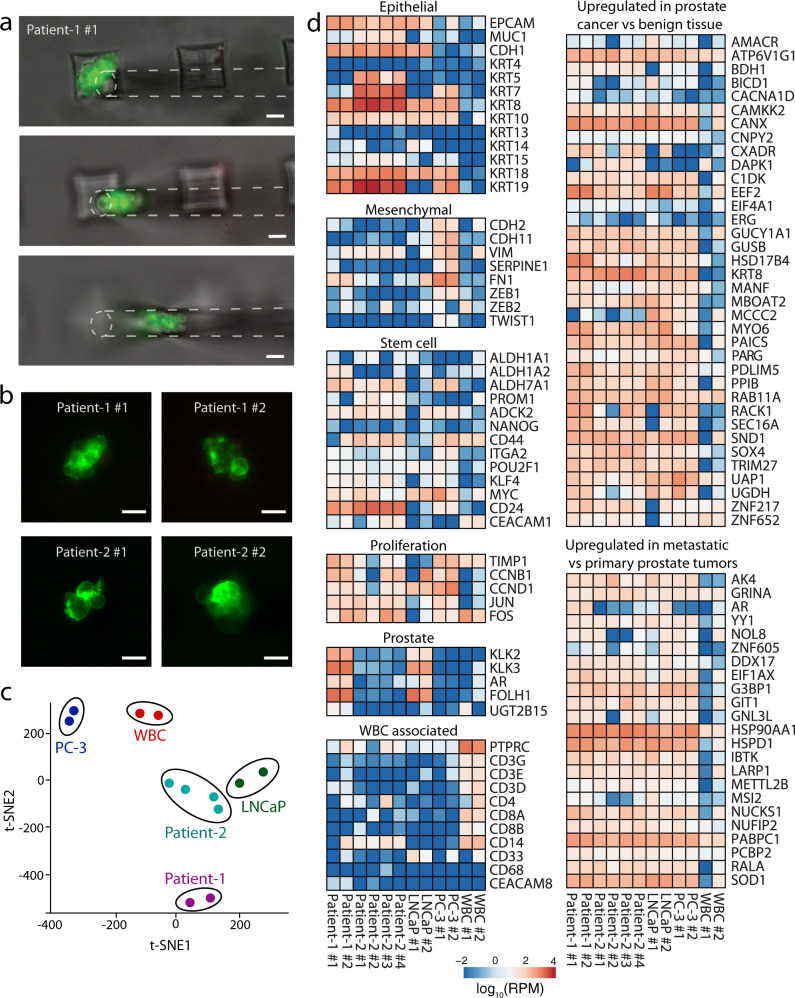
Fig. 5. Molecular analysis of the isolated CTC clusters from prostate cancer patients.
a Micromanipulation of a CTC cluster isolated from the blood sample of a metastatic prostate cancer patient (Patient-1). Following the blood filtration and PBS wash, isolated viable CTC clusters were stained on the device using FITC-conjugated antibodies against EpCAM and prostate specific membrane antigen (PSMA), scanned using fluorescence microscope, and micromanipulated directly from the device. Scale bars, 50 μm. b Representative fluorescence microscope images of the prostate CTC clusters that are subjected to RNA-Seq. Images were taken before they were retrieved from the device for molecular analysis. Scale bars, 20 μm. c t-distributed stochastic neighbor embedding (t-SNE) plot of the sequenced patient clusters, prostate cancer cell lines, and white blood cells. d Heatmap plot illustrating the expression levels of selected genes in isolated CTC clusters from two metastatic prostate cancer patients, prostate cancer cell lines, and white blood cells. RPM reads per million.

