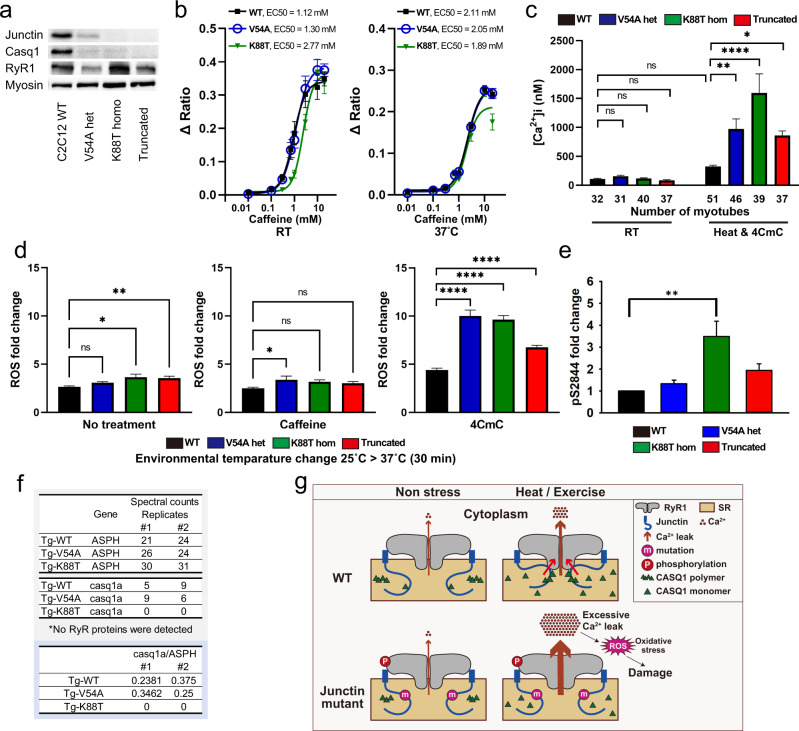
Fig. 4. Analysis of junctin variant knock-in C2C12 myotubes.
a Junctin expression in C2C12 myotubes was assessed by western blotting. Myosin heavy chain was used as a loading control and a differentiation marker and was probed on the same blot as junctin. Blots for Casq1 and RyR1 were processed in parallel using the samples derived from the same experiment. Total protein was also used as loading controls (Source data file). b Concentration dependence of caffeine-induced SR calcium release in C2C12 myotubes. Left panel; at room temperature, 4 replicates in each cell line. Right panel; at 37 °C, 8 replicates in WT and V54A, 9 replicates in K88T. c Resting intracellular calcium concentrations in C2C12 myotubes. Cytosolic calcium concentration was measured at RT or after heat and 50 μM 4CmC exposure. The numbers of myotubes analyzed are shown below each bar. Statistical analysis was by one-way ANOVA followed by Dunnett’s multiple comparisons test. d DCFDA assay in C2C12 shows increased temperature-dependent ROS production in junctin mutant cell lines during 50 μM 4CmC exposure. ROS was measured from 6-day differentiated myotubes after changes in environmental temperature (25 °C for 1 h followed by 37 °C for 30 min) with either no treatment (left panel), 1 mM caffeine (middle panel), or 50 μM 4CmC (right panel). Statistical analysis of three independent replicates was done using one-way ANOVA followed by Dunnett’s multiple comparisons test. e A quantification of RyR1 phosphorylation (relative to WT) as measured by mass spectrometry and confirmed by Western blot analyses. Increased S2844 phosphorylation was seen in K88T cells as compared to controls. f Spectral counts of junctin and Casq1 proteins analyzed by AP-MS from junctin transgenic zebrafish (n = 2 biological replicates). All data in (b–e) are represented as mean ± SEM. Differences were considered to be statistically significant at P < 0.05 (*), P < 0.01 (**), P < 0.001 (***) or P < 0.0001(****). Source data are provided as a Source data file. g Schematic summarizing the results of the study and the predicted impact of junctin variants on CASQ1, RyR1, and stress-related calcium leak.

