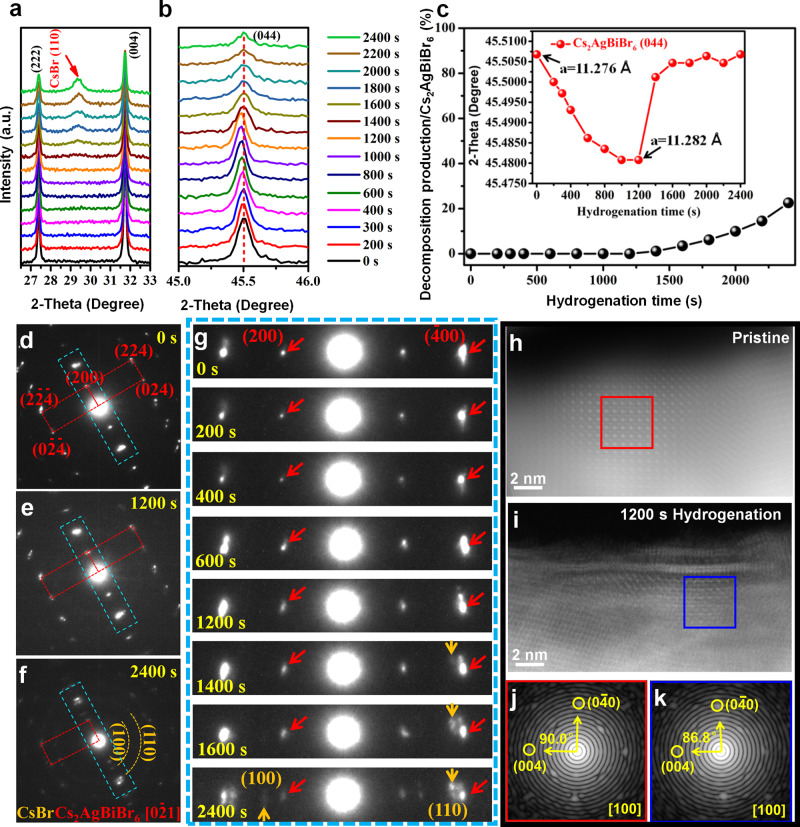
Fig. 4. Analyses on the evolution of Cs2AgBiBr6 films during hydrogenation treatment.
a XRD spectra indicating the generation of CsBr (110) peak (marked by the red arrow) with different hydrogenation time. b XRD spectra of the Cs2AgBiBr6 (044) peak under different hydrogenation time. c Evolution tendency for the XRD area proportion of CsBr (110) peak as compared with the ones of Cs2AgBiBr6, inset shows the peak shift of Cs2AgBiBr6 (044) to the low XRD angle during the hydrogenation treatment. d–g Quasi in situ observation for the structural evolution of hydrogenated Cs2AgBiBr6 film, red and orange markers indicate the Cs2AgBiBr6 and CsBr phases, respectively. The detailed evolution process of the areas marked with baby blue rectangles in Fig. 4d–f were listed in Fig. 4g. h–k HAADF images of pristine and hydrogenated Cs2AgBiBr6 films, and the corresponding Fast Fourier transform (FFT) images for the areas marked by red and blue boxes.

