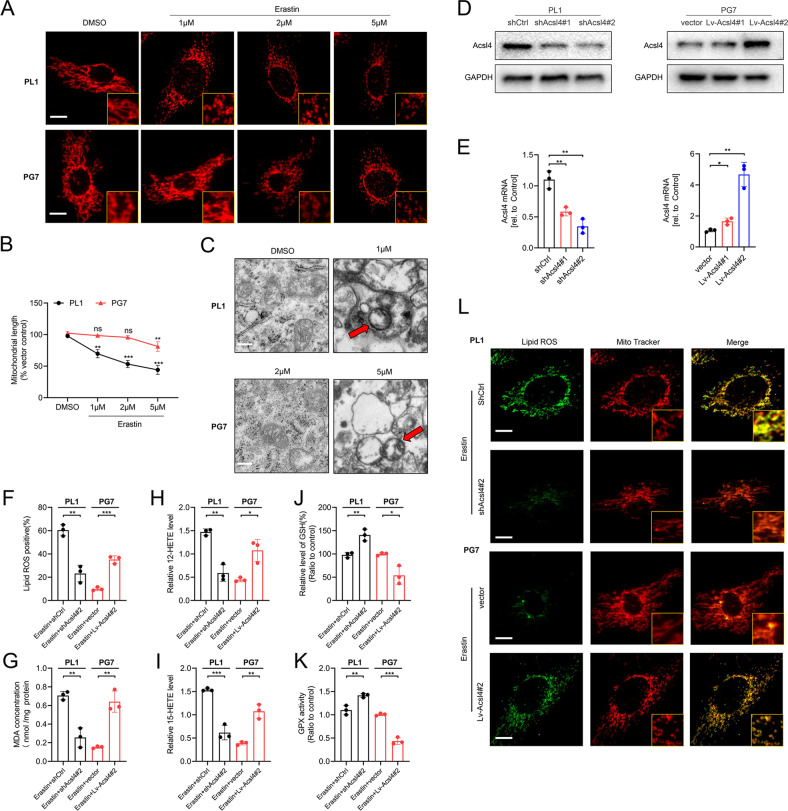
Fig. 2. Acsl4 participates in mitochondrial-morphology regulation in ferroptosis.
A Representative images by immunofluorescence show mitochondrial morphology in PL1 and PG7 cells treated with erastin in a dose-dependent manner (6 h). Scale bar: 10 μm. B The mean length of mitochondria in PL1 and PG7 cells treated with erastin dose dependently (6 h). Data indicated as mean ± S.D. (n = 3 experiments). C Representative transmission electron microscopy images show morphology of mitochondria in PL1 and PG7 cells under erastin treatment (6 h). Mitochondria showed the increased membrane density and shrunken morphology (red arrows). Scale bar: 2 μm. D Acsl4 protein expression levels in Acsl4 shRNA-mediated knockdown PL1 cells and Acsl4-overexpression PG7 cells were determined by western blot. E Acsl4 mRNA expression levels in Acsl4 shRNA-mediated knockdown PL1 cells and Acsl4-overexpression PG7 cells were determined by qPCR. Data indicated as mean ± S.D. (n = 3 experiments). F–K Intracellular ROS, MDA, 12-HETE, 15-HETE, GSH, and GPX activity in PL1 cells after 1 μM erastin treatment and in PG7 cells after 2 μM erastin treatment (6 h). Data indicated as mean ± S.D. (n = 3 experiments). L Confocal images showed colocalization of oxidized lipids (green) and mitochondria (red). PL1 and PG7 cells were treated as indicated before and then stained with BODIPY C11 and MitoTracker. Scale bar: 10 μm. *p < 0.05, **p < 0.01, ***p < 0.001.

