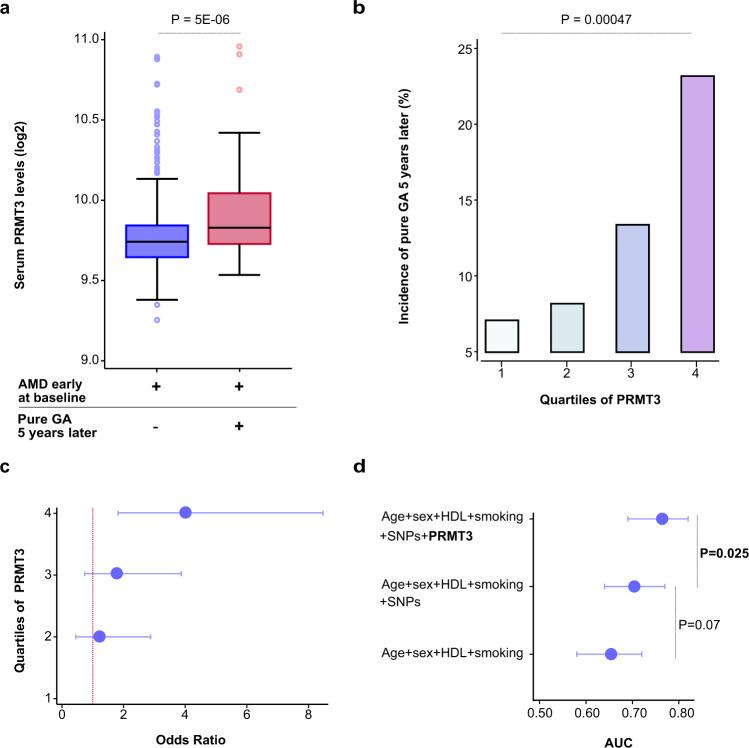
Fig. 3. PRMT3 is a novel biomarker for the progression of geographic atrophy.
a Boxplot depicting the distribution of PRMT3 by progression status on a log2 scale. The blue box represents individuals (n = 428) who had early-stage AMD (definition by Jonasson et al.23) at baseline and after a five-year follow-up, while the red box represents subjects (n = 62) who progressed from early-stage AMD to pure GA. The boxplot indicates median value, 25th and 75th percentiles. Whiskers extend to smallest/largest value no further than 1.5× interquartile range with outliers being shown. The highlighted P-value is two-sided, obtained from age and sex-adjusted logistic regression analysis. b The observed percentage incidence of pure GA at five-year follow-up (y-axis), as represented by PRMT3 quartiles (x-axis), was assessed using an age and sex-adjusted logistic model. The P-value shown is two-sided. c Age and sex-adjusted odds ratios (OR) from a logistic regression model for progression to pure GA after a five-year follow-up by PRMT3 quartiles (1st quartile as reference) (F-test P = 0.001, two-sided). The error bars for the mean OR (center) are the 95% CIs. d Area under the curve (AUC) comparison for various logistic models with incident pure GA as the outcome variable and various predictors such as age, HDL cholesterol (HDL), smoking (current), AMD genetic risk variants (single-nucleotide polymorphisms; SNPs) at chromosomes 1 (rs10922109 and rs570618) and 10 (rs3750846), and PRMT3. The error bars for the mean AUC (center) are the 95% CIs. The highlighted P-values are two-sided.

