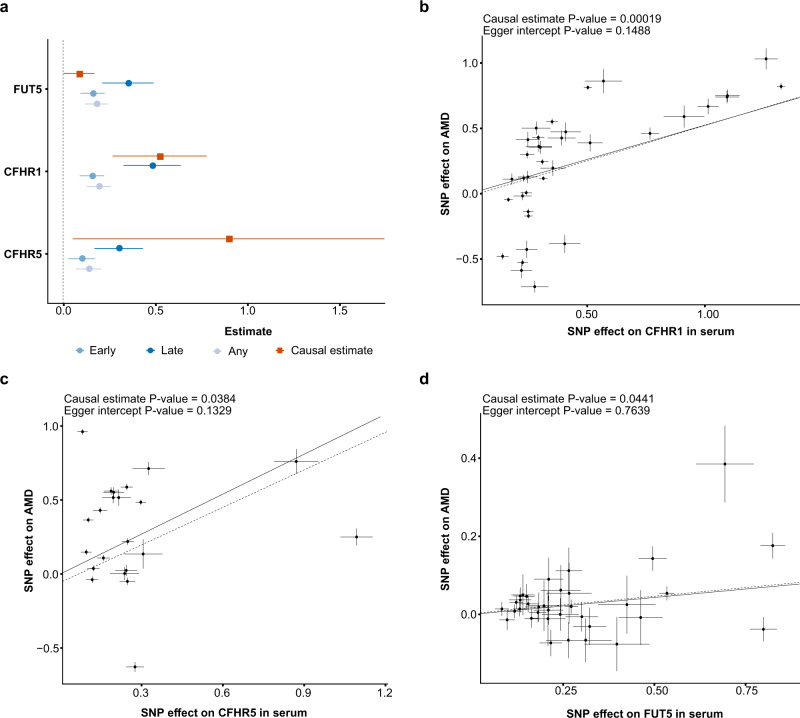
Fig. 7. MR analysis identifies serum proteins that are causally related to AMD.
a The causal estimate (squares) from the two-sample MR analysis compared to the observational estimates (circles) for each of the five proteins with cis-acting instruments and associated with AMD in the observational study (AGES-RS, n = 5457). As each protein could have different observational coefficients depending on which definition of early AMD (see Methods section) was used, it was decided to select and display the coefficient for each definition which had the lower adjusted P-value. The causal estimator for CFHR1, CFHR5 and FUT5 was significant (FDR < 0.05) and positive. Each center data point shows the estimate as beta = log(OR) for the observational estimate and as described in Methods for the causal estimate, along with 95% confidence intervals as error bars. The number of patients in each AMD-related group in the AGES-RS cohort is shown in Supplementary Data 1. b Scatterplot for the CFHR1 protein supported as having a causal effect on AMD in a two-sample MR analysis. The figure demonstrates the estimated effects of the respective cis-acting genetic instruments on the serum CFHR1 levels in AGES-RS (x-axis) and risk of AMD through a GWAS provided by the IAMDGC consortium (n = 16,144 AMD patients)10 (y-axis). The solid line indicates the generalized weighted causal estimate (β = 0.524, SE = 0.126, P = 0.00019, two-sided), while the dotted line shows the MR-Egger regression. Similar plots as in b are shown for c CFHR5 (β = 0.899, SE = 0.407, P = 0.0384, two-sided), and d FUT5 (β = 0.087, SE = 0.041, P = 0.0441, two-sided). Each data point in the center of the scatter plots in b–d represents the SNP effect (log(OR)) on disease with vertical lines as error bars (95% CIs) versus the SNP effect (beta-coefficient) on the protein with horizontal lines as error bars (95% CIs). The P-values (two-sided) for the Egger intercept and the GWLS causal estimates are displayed at the top of each scatter plot. The causal estimates for the three proteins in b–d were found to be significant after adjusting the P-value with the Benjamini–Hochberg method (see Methods section).

