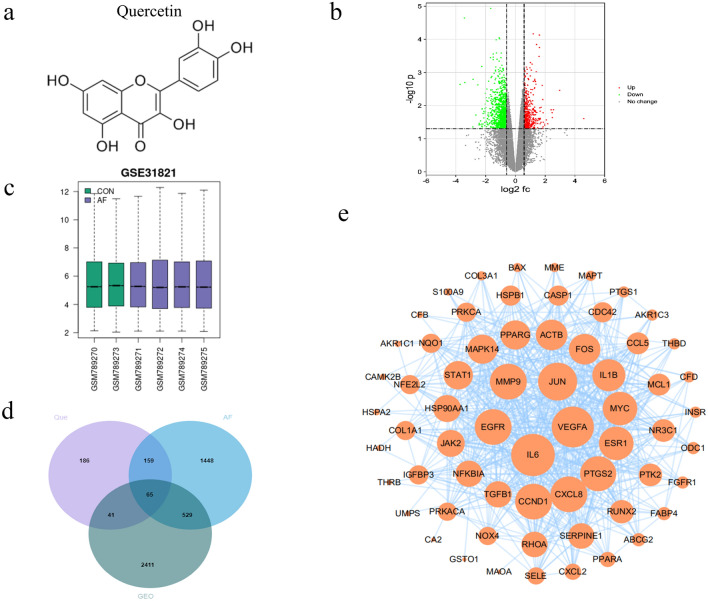
Figure 2.
Protein–protein interaction (PPI) networks construction for target proteins of Que against AF. (a) The chemical structure of the quercetin. (b) GEO Volcano Map. Red upregulates the target, green downregulates the target; (c) GEO Difference Chart Differential. Gene expression in normal subjects (green) vs AF patients (purple). (d) Venn diagram of Que AF and GEO. (e) PPI network of Que against AF. The larger the circle and the darker the color, the stronger the correlation with the therapeutic target.

