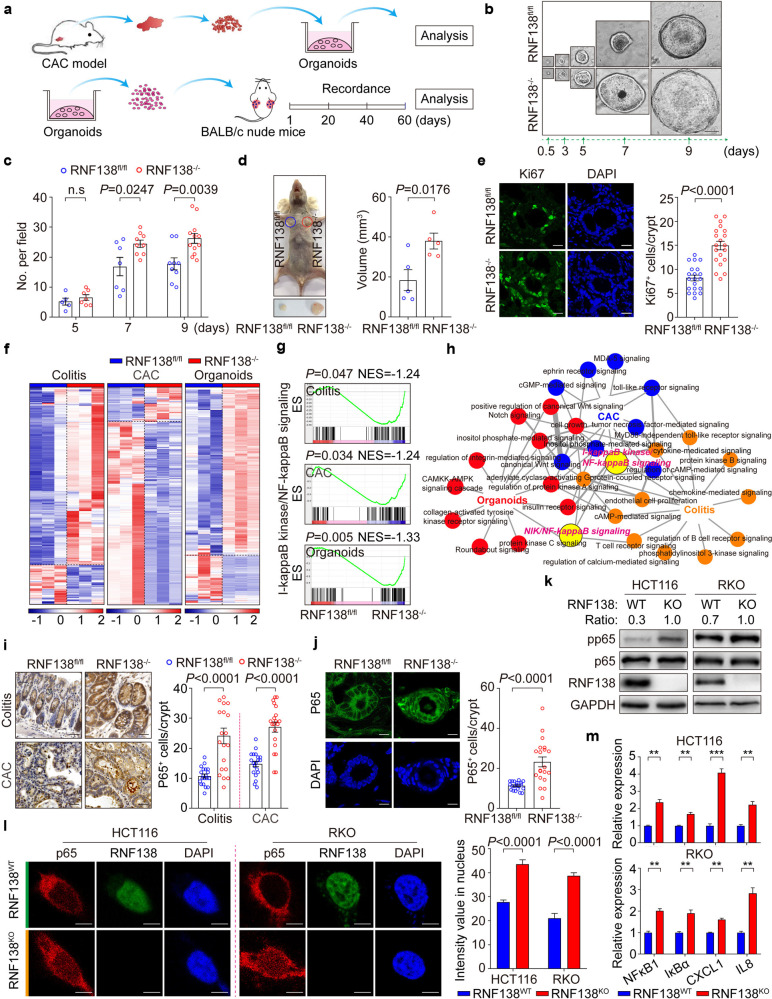
Fig. 3.
RNF138 inhibits chronic colitis and CRC tumorigenesis via NF-кB signaling. a Schematic overview of in vitro organoid culture of primary mouse colorectal tumors (top) and xenografts (bottom). b Representative images of mouse tumor organoids at different time-points. Scale bar, 200 μm. c Quantification of mouse intestinal tumor organoid numbers per field from the 5th to 9th day. d Representative images of xenograft tumor organoids in RNF138fl/fl and RNF138−/− mice (n = 5) on the 60th day after implantation (left). Quantification of the tumor volume at endpoint (right). e Representative images for Ki67-staining and DAPI of xenograft tumor organoids (left). Quantification of number of Ki67-positive cells per crypt (n = 20, right). Scale bar, 20 μm. f Heatmap depiction of differentially expressed genes in RN138fl/fl and RNF138−/− colorectal cells. g GSEA of NF-kappa B signaling relative to RNF138−/− against RNF138fl/fl mice in colitis, CAC, and organoid models. Enrichment plots are shown along with the normalized enrichment score and P value. h Protein-protein interaction analysis of significant GO terms in colitis, CAC, and organoid models. Circles at nodes represent GO terms in one model (orange, colitis; blue, CAC; red, organoid model; yellow, I-κB kinase/NF-κB, and NIK/NF-κB signaling). i Representative p65-staining of colorectal sections from RNF138fl/fl and RNF138−/− mouse colitis (top) and CAC (bottom) models. Quantification of nuclear p65-positive cells per crypt (n = 20) (right). Scale bar, 25 μm. j Representative images of p65-immunostaining and DAPI from xenograft tumor organoids (left). Quantification of nuclear p65-positive cells per crypt (n = 20) (right). Scale bar, 20 μm. k Immunoblots of phosphorylation and total levels of p65 in RNF138WT and RNF138KO CRC cells. l Representative images of p65-immunostaining in RNF138WT and RNF138KO HCT116 (left) and RKO (right) cells. Histogram shows the quantification of nuclear p65 intensity (n = 20). Scale bar, 5 μm. m qPCR analysis of NF-кB target genes expression in RNF138WT and RNF138KO HCT116 (top) and RKO (bottom) cells (n = 3). **P < 0.01 and ***P < 0.001

