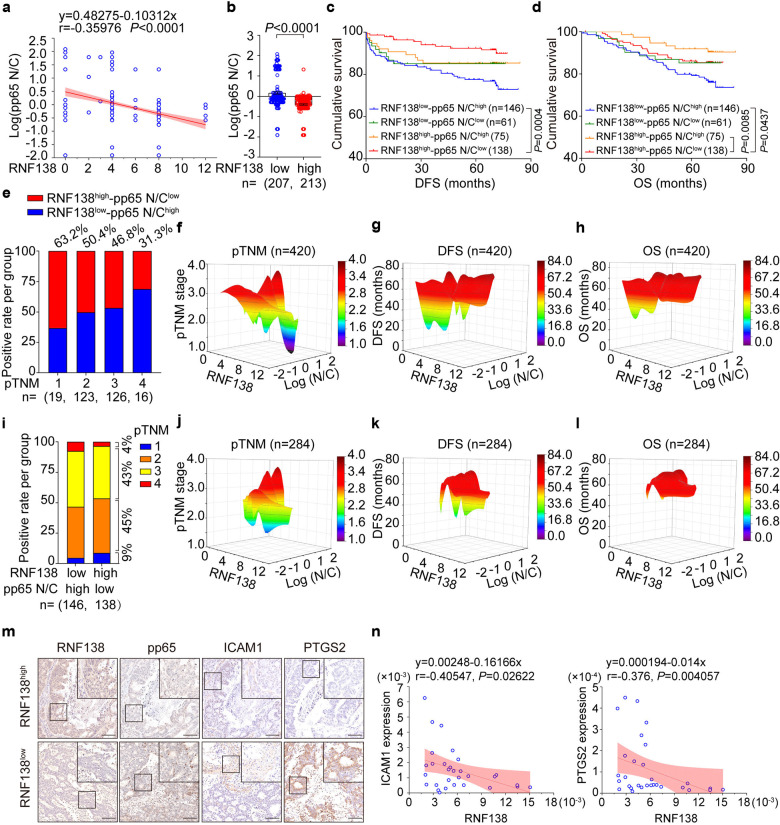
Fig. 6.
RNF138 reduction coincided with aberrant activation of NF-кB signaling and correlated with unfavorable clinical outcomes in the CRC patients. a Correlation between log(pp65 N/C) and RNF138-staining according to Pearson’s test. The formula, coefficient of correlation (r), and the P value are indicated (n = 420). b Assessment of log(pp65 N/C) expression levels in low (n = 207) and high (n = 213) RNF138 CRC tissues. Data are mean ± SEM. Kaplan–Meier survival curves of DFS (c) and OS (d) stratified by RNF138 and pp65 N/C expression in CRC TMAs (n = 420). Log-rank test was used. e Percentages of RNF138high-pp65 N/C ratiolow (red) and RNF138low-pp65 N/C ratiohigh (blue) according to pTNM stage (1, 2, 3, 4) (n = 284). Correlation among RNF138, log(pp65 N/C), and pTNM stage (f), DFS (g), and OS (h) in CRC patient TMAs (n = 420). Log(N/C) indicates log(pp65 N/C). i Percentages of pTNM stage in RNF138high-pp65 N/C ratiolow (n = 138) and RNF138low-pp65 N/C ratiohigh (n = 146) in CRC patient TMAs (n = 284). Correlation among RNF138, log(pp65 N/C), and pTNM stage (j), DFS (k), and OS (l) in CRC patient TMAs (n = 284). Log(N/C), log(pp65 N/C). m IHC analysis of pp65, ICAM1, and PTGS2 in low- and high-RNF138-expressing CRC samples. Scale bar, 100 μm. n Correlation between RNF138 mRNA levels and NF-κB target genes according to qPCR analysis. The formula, coefficient of correlation (r), and the P value were provided via Pearson’s test (n = 30)

