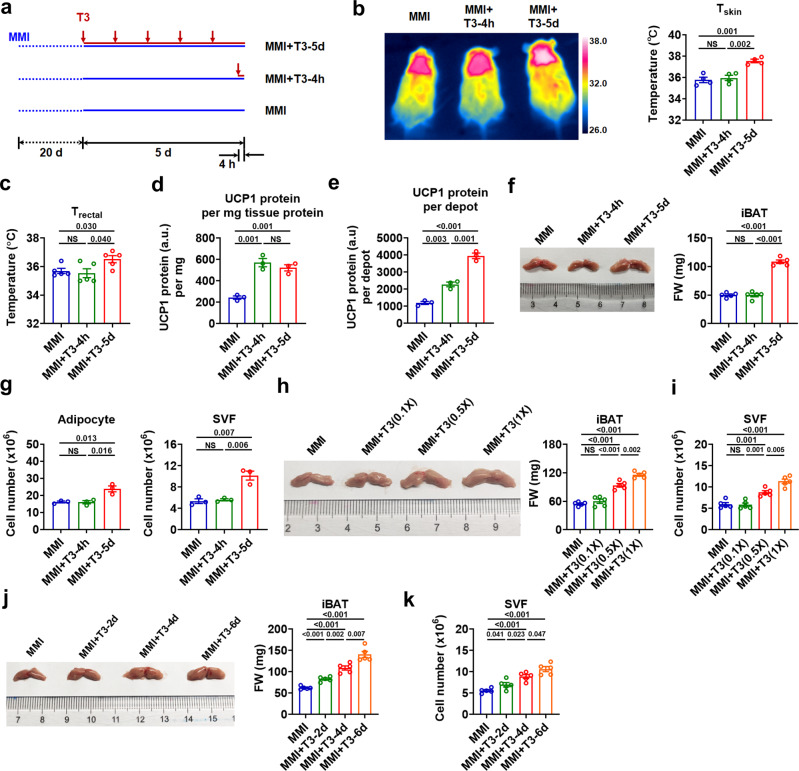
Fig. 1. T3 increases thermogenic capacity by promoting iBAT expansion.
a Schematic of short-term (MMI + T3-4h) and long-term (MMI + T3-5d) T3 treatments of hypothyroid (MMI) mice. b Representative infrared images (left) and quantification of average dorsal skin temperature (Tskin) (right) of MMI mice and MMI mice with different T3 treatments (n = 4). c Rectal temperature (Trectal) of MMI mice and MMI mice with different T3 treatments (n = 5). d, e UCP1 protein amount per mg iBAT protein (d) and total UCP1 protein amount per iBAT depot (e) in MMI mice and MMI mice with different T3 treatments (n = 3). f Representative photograph (left) and fat weight (FW) (right) of iBAT depot from MMI mice and MMI mice with different T3 treatments (n = 5). g Number of mature adipocytes (left) and stromal vascular fraction (SVF) cells (right) of iBAT per mouse in MMI mice and MMI mice with different T3 treatments (n = 3). iBAT was minced and then digested for 40 min. h Representative photograph (left) and FW (right) of iBAT depot from MMI mice and MMI mice receiving daily T3 injection for 4 d at indicated doses (n = 5). i Number of SVF cells of iBAT per mouse in MMI mice and MMI mice receiving daily T3 injection for 4 d at indicated doses (n = 5). j Representative photograph (left) and FW (right) of iBAT depot from MMI mice and MMI mice receiving daily T3 injection for indicated days at 0.5X standard dose (n = 5). k Number of SVF cells of iBAT per mouse in MMI mice and MMI mice receiving daily T3 injection for indicated days at 0.5X standard dose (n = 5). Means ± SEM are shown. P values were calculated by two-tailed unpaired Student’s t test for b-k. NS, not significant. Source data are provided as a Source Data file.

