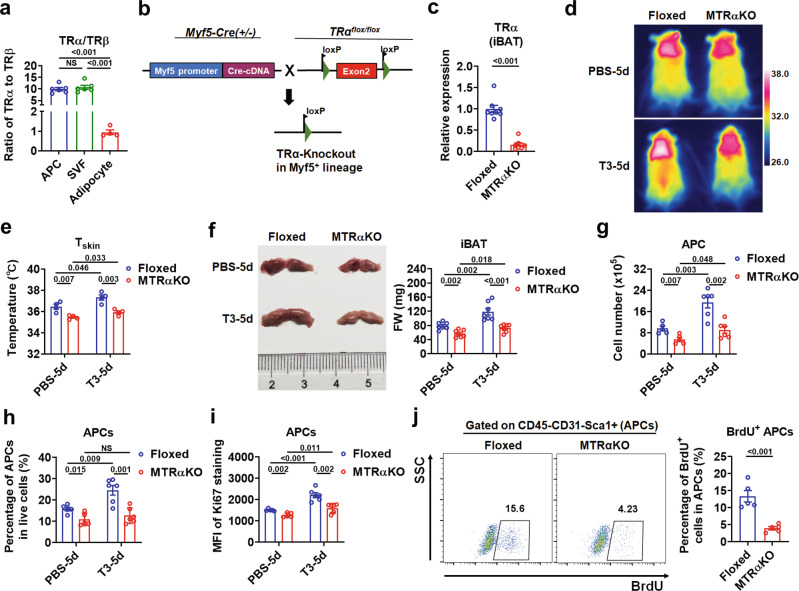
Fig. 3. Deletion of TRα with Myf5-Cre blunts the T3 effect on iBAT hyperplasia.
a Ratio of the amount of TR transcripts (TRα vs TRβ) assessed by qRT‐PCR in APCs (n = 6), cultured SVF cells (n = 6) and SVF-derived mature brown adipocytes (n = 4). b Breeding scheme for generating the MTRαKO mice. c Relative TRα mRNA levels in iBAT depots of TRαFloxed (Floxed) and MTRαKO mice (n = 8). d, e Representative infrared images (d) and quantification (e) of average dorsal Tskin of Floxed and MTRαKO mice with daily PBS or 0.5X standard dose of T3 injection for 5 d (n = 4). f Representative photograph (left) and FW of iBAT (right) of Floxed and MTRαKO mice with daily PBS or 0.5X standard dose of T3 injection dose for 5 d (n = 7). g Number of APCs in iBAT per mouse from Floxed and MTRαKO mice with daily PBS (n = 5) or 0.5X standard dose of T3 (n = 6) injection for 5 d. h Percentage of APCs in live SVF cells of iBAT from Floxed and MTRαKO mice with daily PBS (n = 5) or 0.5X standard dose of T3 (n = 6) injection for 5 d. i MFI of Ki67 staining in APCs of iBAT from Floxed and MTRαKO mice with daily PBS (n = 5) or 0.5X standard dose of T3 (n = 6) injection for 5 d. j FACS plot and quantification of the BrdU+ APCs in iBAT from Floxed and MTRαKO mice with daily T3 injection at 0.5X standard dose for 5 d (n = 5). Cells were pre-gated on live CD45−CD31−Sca1+ cells. Means ± SEM are shown. P values were calculated by two-tailed unpaired Student’s t test for a, c, e–j. NS, not significant. Two-way ANOVA was performed for the data in g–i additionally, and the results were show in Supplementary Table 1–3. Source data are provided as a Source Data file.

