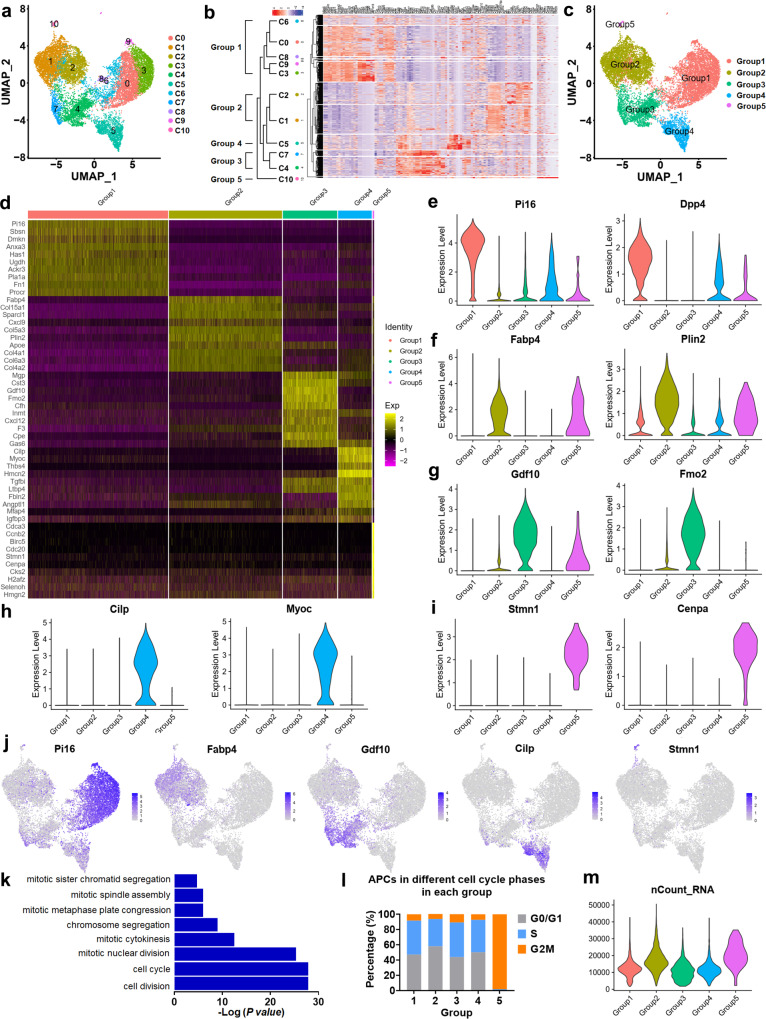
Fig. 5. scRNA-seq analysis reveals cellular heterogeneity of APCs in iBAT.
a UMAP plot presenting cellular heterogeneity of APCs in iBAT with 11 distinct clusters of cells identified and color-coded. b Unsupervised hierarchical clustering of gene signatures showing relatedness of clusters. c UMAP plot of APCs presenting 5 distinct groups. d Heatmap of differentially expressed genes (DEGs) between different groups. Top 10 genes and their scaled expression are shown. e–j Violin plots (e–i) or feature plots (j) of expression levels and distribution for top ranked (e–i, left and j) and selected (e–i, right) group-specific genes. k GO analysis of top 50 up-regulated genes of Group 5. l Cell cycle scoring for APCs in iBAT. Stacked bar chart showing relative abundance of cells from different cell cycle phases in each group. m Violin plot of total mRNA molecules in distinct groups. P values were calculated by hypergeometric distribution (two-tailed) for k. Source data are provided as a Source Data file.

