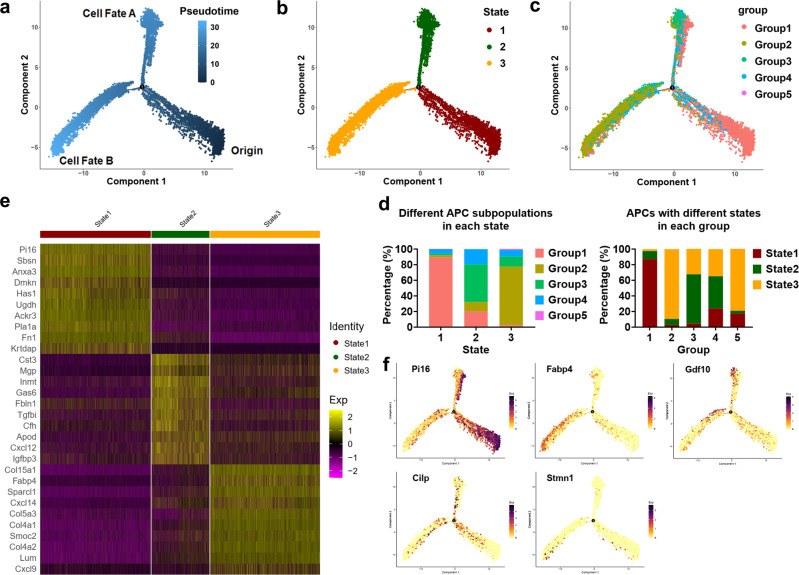
Fig. 6. Pseudotime developmental trajectories of APCs in iBAT.
a–c Pseudotemporal cell ordering along trajectories of APCs in iBAT. Pseudotime is depicted from dark to light blue (a). Cells were classified into 3 states (b). Group identities were overlaid on pseudotime trajectory map (c). d Stacked bar chart showing the abundance of cells from distinct groups in 3 states or from distinct states in 5 groups. e Heatmap of DEGs between different states. Top 10 DEGs and their scaled expression are shown. f Feature plots of expression distribution for group markers across pseudotime. Source data are provided as a Source Data file.

