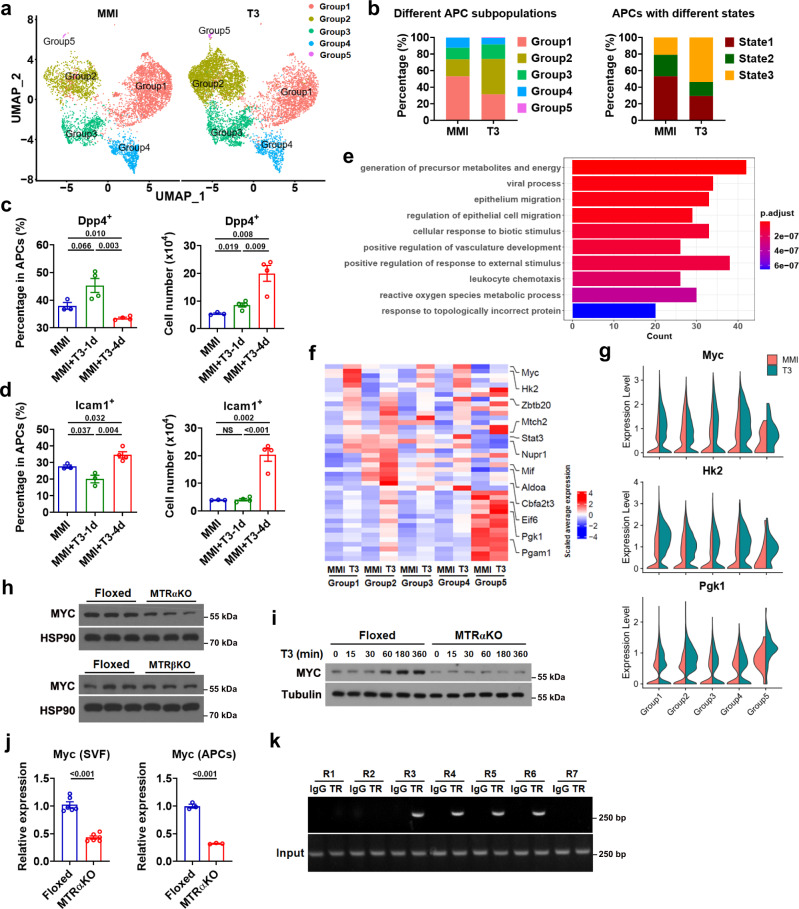
Fig. 8. T3 promotes cell state transition and cell cycle progression and regulates Myc transcription.
a UMAP plots of APCs from iBAT of MMI mice (MMI group) and MMI mice treated with T3 at 0.5X standard dose for 4 d (T3 group). b Stacked bar chart showing relative abundance of cells from distinct groups (left) and from distinct states (right) in MMI group or T3 group. c, d Percentage of Dpp4+ APCs (c, left) and Icam1+ APCs (d, left) and number of Dpp4+ APCs (c, right) and Icam1+ APCs (d, right) (per mouse) in iBAT of MMI mice (n = 3) and MMI mice with daily T3 injection at 0.5X standard dose for 1 d (n = 4 for c and d, right; n = 3 for d, left) or 4 d (n = 4). e GO analysis of the up-regulated genes in T3 group vs MMI group. Bar chart showing the 10 most enriched biological processes. f Heatmap showing scaled average expression of genes belonging to GO:0006091 in Group 1–5 from MMI group and T3 group. Genes related to glycolysis are listed on the right. g Violin plots showing the expression levels and distribution of Myc, Hk2 and Pgk1, split by “orig.ident” (MMI group and T3 group). h Western blot analysis of Myc in cultured SVF cells from the iBAT of MTRαKO and MTRβKO mice with their corresponding Floxed mice. i Western blot analysis of Myc in cultured SVF cells from the iBAT of Floxed and MTRαKO mice with T3 treatment for indicated time. j Relative mRNA expression of Myc in cultured SVF cells (n = 6) or APCs (n = 3) from the iBAT of Floxed and MTRαKO mice. k ChIP-PCR analysis of the recruitment of HA-TRα to mouse Myc promoter in BAC cells after T3 treatment for 24 h. Means ± SEM are shown. P values were calculated by two-tailed unpaired Student’s t test for c, d, and j, and were calculated by hypergeometric distribution (two-tailed) and adjusted by Benjamini-Hochberg correction for e. NS, not significant. Source data are provided as a Source Data file.

