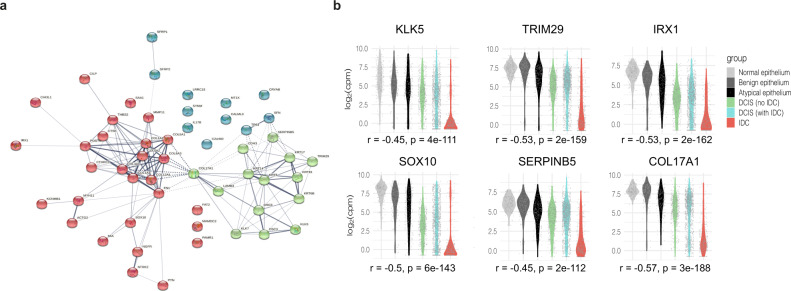
Fig. 2. Differentially expressed genes between DCIS and co-occurring IDC.
a String connectivity with k-means clustering [3 clusters identified by red, green and blue] of the top 53 significant genes. b Expression distribution, in log2 counts per million (CPM), for example genes that showed a progressive shift among different tissue groups. The Spearman rank correlation (between expression and ordered tissue groups) is given as r = rho. Two-sided p-values without correction for multiple testing are indicated.

