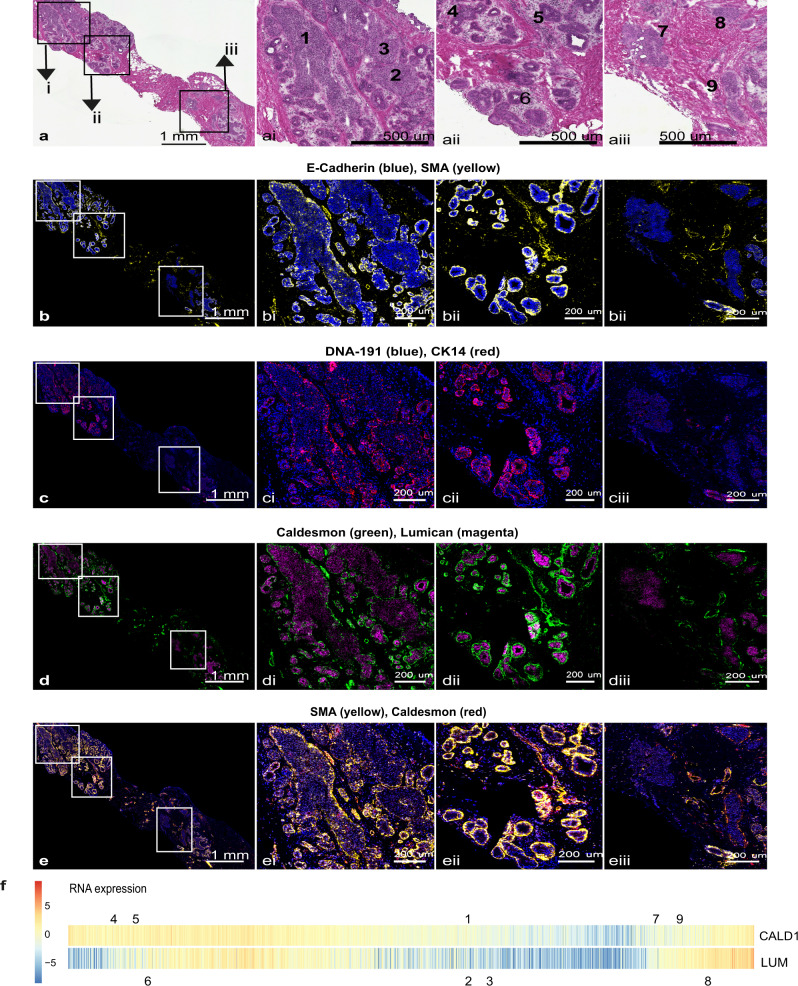
Fig. 4. Imaging Mass cytometry of ductal regions from patient sample CBZ (LumA subtype).
The single slide was analysed in one continuous scan and magnified regions retained the same intensity threshold. a shows H&E stained section, this same section was destained and used for IMC. Boxed areas indicate the corresponding magnified regions shown in ai, ii and iii. b shows E-Cadherin and SMA, with corresponding boxed areas for i, ii and iii. c Shows CK14 and nuclear stain DNA-191, with corresponding boxed areas for i, ii and iii. d shows Caldesmon and Lumican and e shows SMA and Caldesmon, with corresponding boxed areas for i, ii and iii. Numbers on the H&E images indicate regions with expression data from adjacent sections. f shows the relative gene expression of Cald1 and Lum (as in Fig. 3b) with all samples ordered along the PCP continuum. Numbers above and below pair up with numbers in (a) and mark the position on the PCP continuum for the two (adjacent) data points corresponding to each region.

