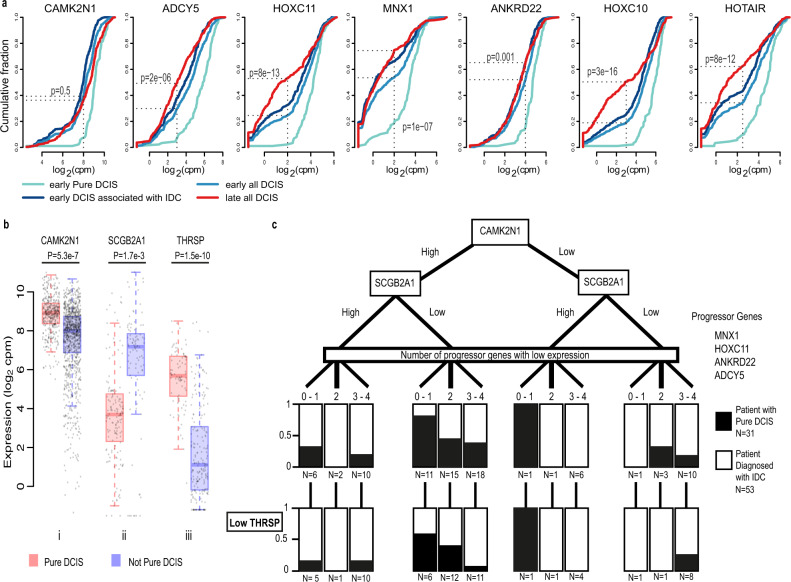
Fig. 6. Genes displaying potential as indicators of progression from DCIS to IDC.
a Cumulative frequency plots for differential genes between early positioned Pure DCIS and early positioned Not Pure DCIS. X axis shows the gene expression in log2 counts per million (CPM), Y axis shows the cumulative fraction of samples with the corresponding expression value or lower. Significance values reflect the two-sided Fisher’s exact test for a difference between cumulative fraction of all early DCIS compared to all late DCIS. b Expression in log2 counts per million (CPM), of i CAMK2N1 for all DCIS samples (n = 385 Pure DCIS samples and n = 1014 Not Pure DCIS samples), ii of SCGB2A1 for all samples belonging to patients in the Low Hazard group – 1 progressor gene down regulated and CAMK2N1 high (n = 148 Pure DCIS samples and n = 97 Not Pure DCIS samples), and iii THRSP for all samples belonging to patients with 3–4 progressor genes down regulated, CAMK2N1 high and SCGB2A1 low (n = 84 Pure DCIS samples and n = 199 Not Pure DCIS samples). Centre line represents the median, box limits represent upper and lower quartiles, whiskers represent minimum and maximum values and at most 1.5x the interquartile range. Each point represents a sample. Differential expression analysis was done using limma-voom and two-sided p-values were adjusted for multiple testing using Benjamini–Hochberg correction. c Separation of patients with no IDC identified in our tissue biopsy. In all, 31 patients were never diagnosed with IDC after 10+ years of care, 53 patients were diagnosed with IDC in a secondary biopsy or at a later timepoint. Black/white regions reflect the proportion of patients with each diagnosis (Pure DCIS vs with IDC) within each node. Boxes in the low THRSP layer reflect the number of THRSP low patients from the node above.

