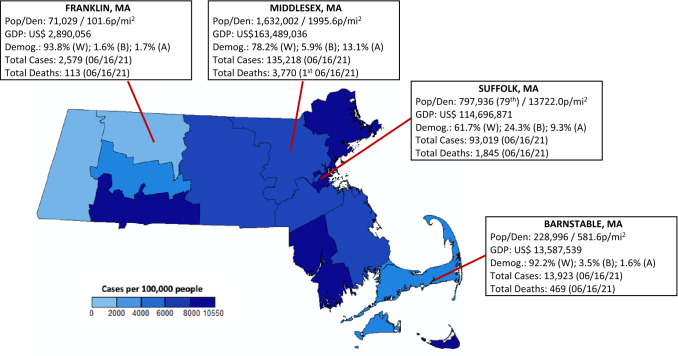
Fig. 4.
Map of the Commonwealth of Massachusetts indicating COVID-19 rates (as of 6/16/2021) and socio-economic profile of the four rural and metropolitan areas included in this study. Population and demographic data (2020) from (Census 2021); GDP data (2019) from (BEA 2019); COVID case counts and death data from (JHU 2021)

