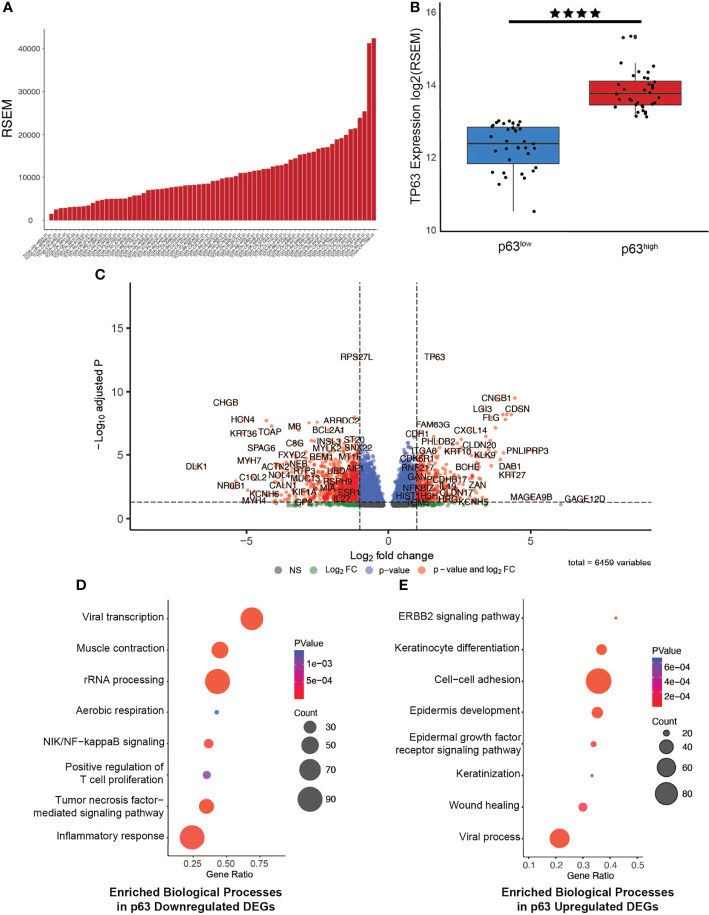
Figure 1.
Generation of a p63-driven gene signature in HPV+ HNSCC TCGA tumors. (A) Bar chart of p63 expression across tumors in the TCGA HPV+ HNSCC dataset. (B) Boxplots displaying the significant difference in expression of TP63 between the groups (p value = 2.472e-6). Tumors were segregated into p63low and p63high groups on the basis of median p63 expression. (C) Volcano plot of identified DEGs between p63low and p63high samples. TP63 is shown as one of the most significant DEGs. (D) Gene Ontology (GO) based biological pathway analysis of DEGs whose expression was downregulated according to p63 expression. (E) GO biological pathway analysis of DEGs whose expression was upregulated according to p63 expression. **** symbol means a p-value of ≤ 0.0001.

