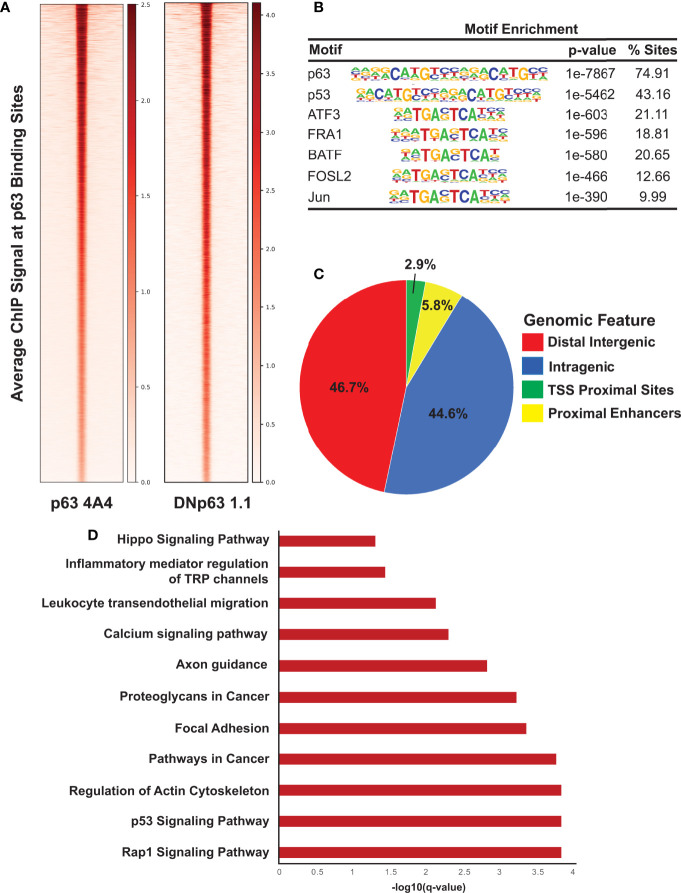
Figure 2.
ChIP-seq analysis reveals direct p63 targets in SCC104 cells. (A) Heatmap of the average ChIP-seq signals from p63 binding sites for two p63 antibodies across the genome. (B) Top transcription factor motifs derived from HOMER’s motif analysis on SCC104 consensus p63 ChIP peaks. (C) Distribution pattern of genomic features associated with p63 binding sites across the genome. (D) Bar graphs displaying selected top enriched KEGG pathways associated with genes identified through GREAT analysis of the top 2,500 p63 ChIP-seq peaks.

