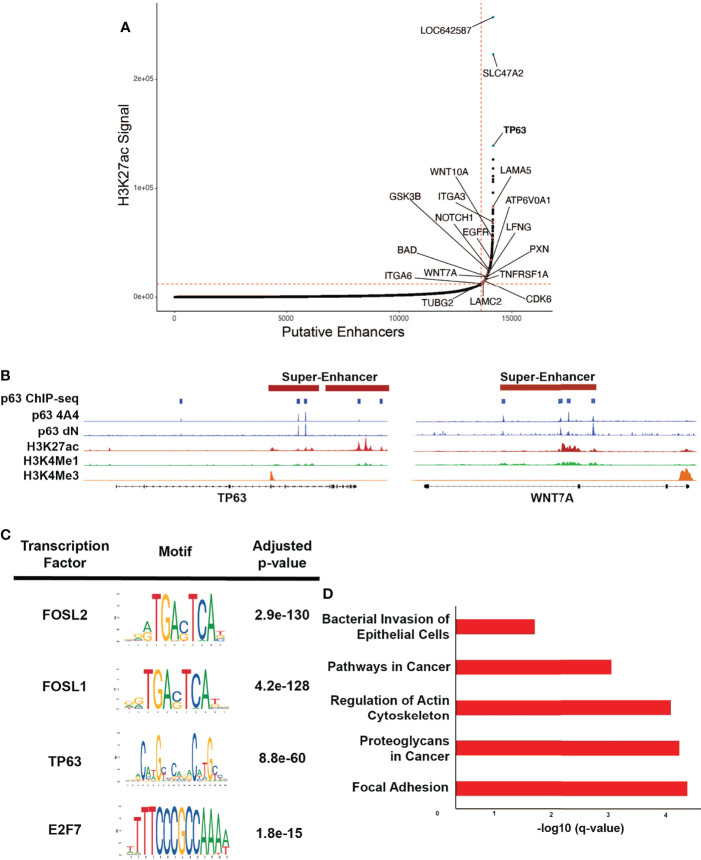
Figure 3.
p63 binding enriched at SEs in SCC104. (A) Hockey plot displaying the ranked H3K27Ac ChIP-seq signal in SCC104 cells. Representative genes marked by super-enhancers (SE) are shown. TP63 is highlighted in blue as one of the top SE-associated genes in SCC104. Other labeled points represent genes that have been found in previous literature to be associated with HPV infection. (B) Integrative Genomics Viewer (IGV) based representation of Histone and p63 ChIP-seq data from SCC104 cells showcasing peaks of binding around the TP63 and WNT7A loci. (C) Top enriched transcription factor motifs found in SE regions in SCC104 cells. (D) Bar graphs displaying selected top enriched KEGG pathways associated with genes identified through ROSE analysis of the SE landscape in SCC104 cells.

