Figure 6.
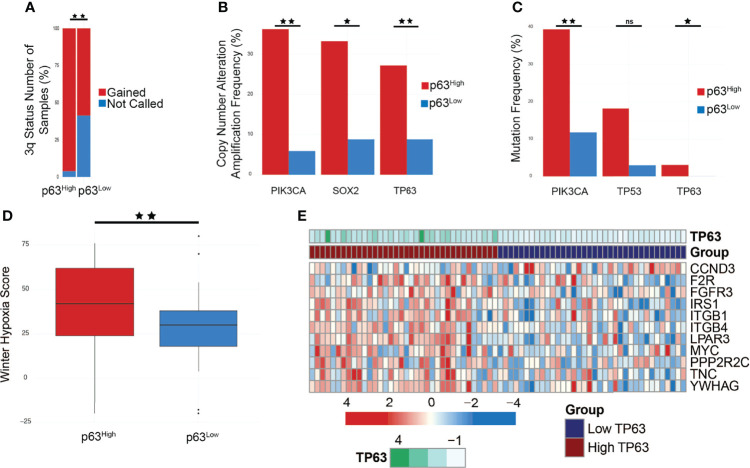
PIK3CA is amplified and mutated in p63high tumors and affects PI3K signaling. (A) Bar graph comparing chromosome 3q status between p63high and p63low TCGA samples (p < 0.01). (B) Copy number alteration (CNA) frequencies in p63high and p63low TCGA samples (PIK3CA, p = 2.242e-3; SOX2, p = 0.0141; TP63, p = 0.0483). (C) Mutation frequencies in p63high and p63low TCGA samples (PIK3CA, p = 9.522e-3; TP53, p = 0.0482; TP63, p = 0.493). (D) Boxplot of the Winter hypoxia scores for p63high and p63low TCGA samples (p = 0.0121). (E) Heatmap of genes involved in PI3K signaling that were present in the combined cell line/TCGA based p63 signature. *p-value of ≤ 0.05, **p-value of ≤ 0.01, ns, non-significant.

