Figure 7.

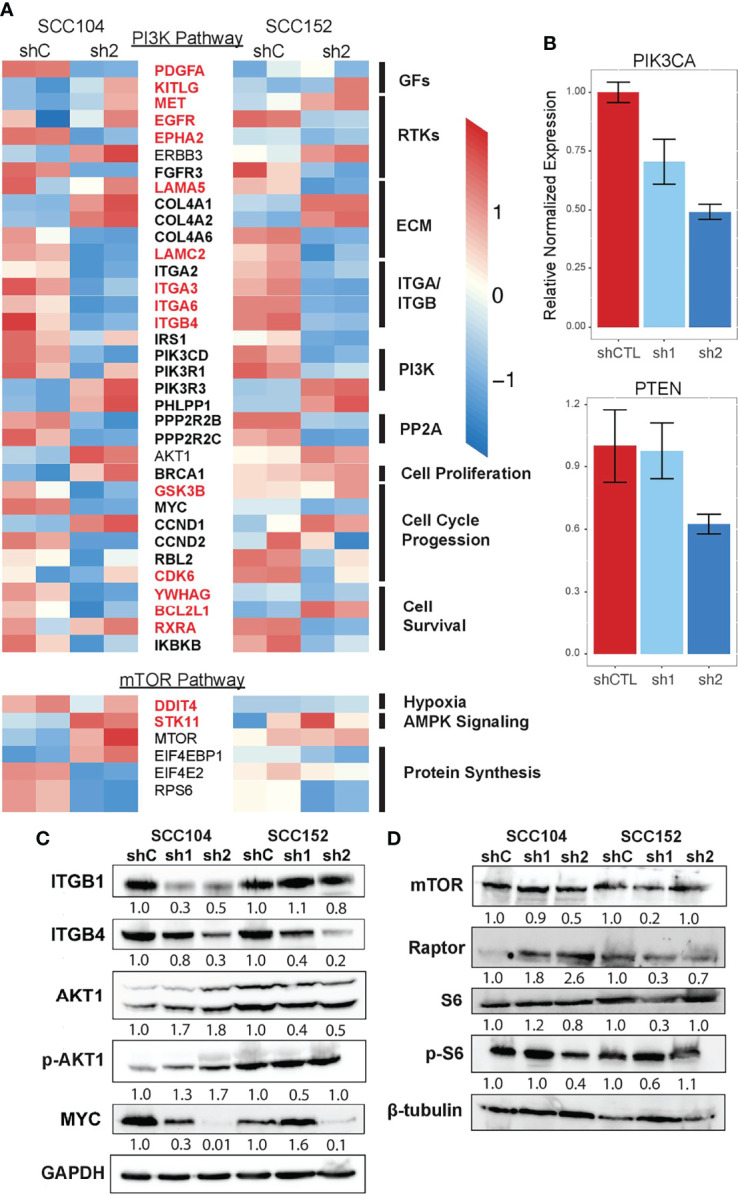
PI3K and mTOR signaling is downregulated upon loss of p63 expression. (A) Heatmap of select DEGs shared between SCC104 and SCC152 cells after p63 knockdown that are associated with activation and regulation of the PI3K signaling pathway. Red-labeled genes are SE marked, and bolded genes are direct p63 targets. (B) qRT-PCR of SCC104 shCTL and p63 shRNA cell lines. Graphs show the relative normalized expression of the catalytic subunit of PI3K as well as the PI3K phosphatase PTEN. (C, D) Western blot results for representative key members of the PI3K pathway (C) and mTOR pathway (D) upon p63 knockdown in SCC104 and SCC152. Densitometric analysis of protein abundance between control (shC) and knockdown (sh1 and sh2) conditions is displayed below each blot.
