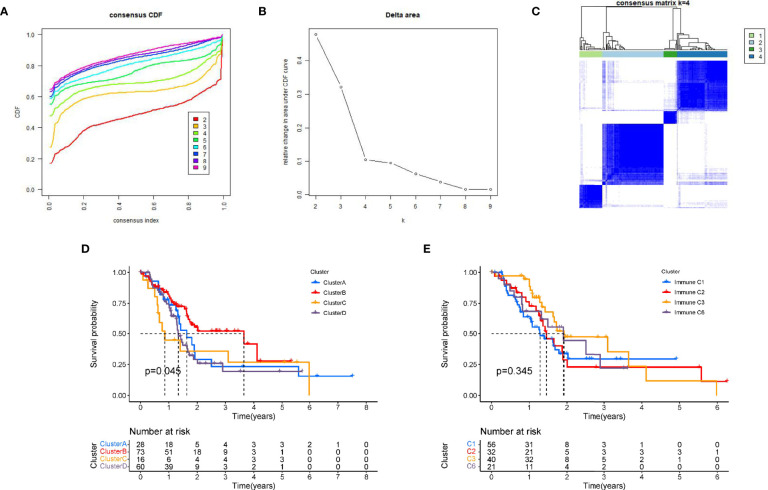
Figure 2.
Tumour classification based on the prognostic PRGs. (A) The relative change of the area under the CDF curve from 2 to 10 of k. (B)The consistency clustering cumulative distribution function (CDF) when k is between 2 and 10. (C) At k=4, the correlation between groups. (D) Kaplan-Meier survival analysis among four clusters. (E) Kaplan-Meier survival analysis among immune subtypes reported in prior literature.

