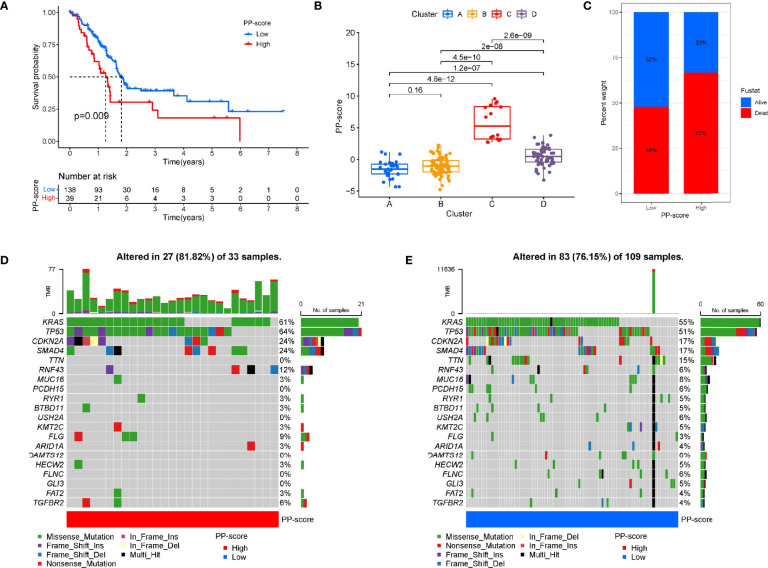
Figure 3.
Construction of pyroptosis score and correlation with tumour classification. (A) Kaplan-Meier survival curve between high and low PP-score group. (B) The correlation between tumour classification and PP-score. (C)The correlation between PP-score and survival state in PAAD patients. (D-E) The waterfall plot of tumor somatic mutation in high PP-score and low PP-score group.

