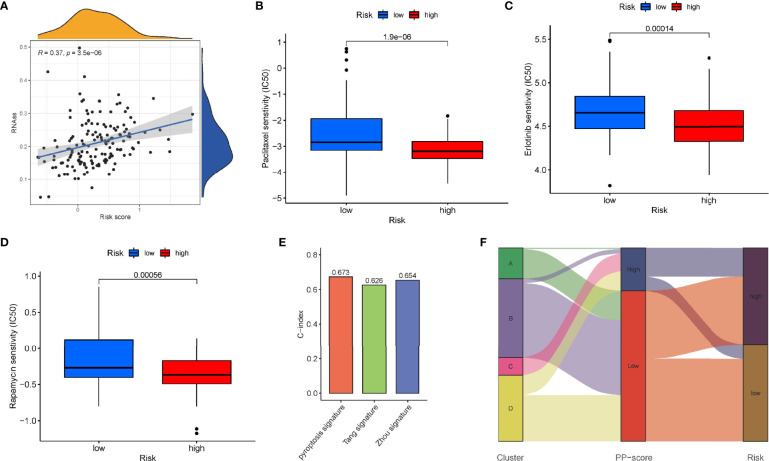
Figure 8.
Sensitivity to chemotherapeutic agents in the high - and low-risk groups. (A) RNAss between high- and low-risk groups. IC50 of (B) paclitaxel, (C) erlotinib and (D) rapamycin between high- and low-risk groups. (E) Comparison of the C-index of our model with other previously established models. (F) Sankey diagram showing the correlation among tumour classification, PP-score and risk signature.

