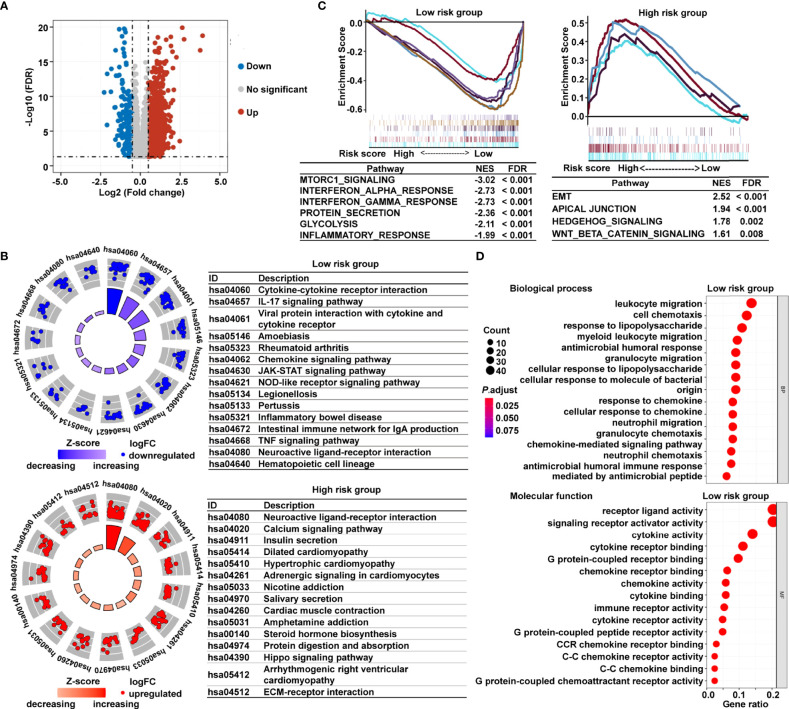
Figure 5.
Functional analysis of DEGs based on the cancer-immunity cycle–related signature between low- and high-risk CRC patients. (A) Volcano map of DEGs between the low- and high-risk groups from TCGA data set. (B) KEGG pathways enriched in the low- and high-risk CRC patients. (C) GSEA enrichment plots of the high-risk and low-risk CRC patients. (D) The 15 most significantly enriched GO terms in low-risk CRC patients are listed. DEGs, differentially expressed genes.

