Figure 7.
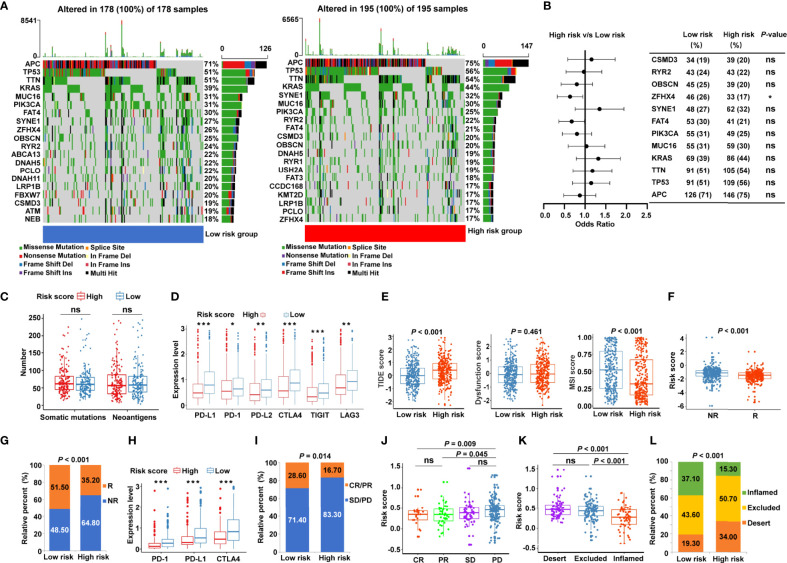
Identification of the cancer-immunity cycle–based signature for predicting immunotherapy response in CRC. (A) The waterfall plot of somatic mutation features in low- and high-risk patients using TCGA-COAD data set. (B) The forest plot illustrating the differences in the top 10 mutation frequencies of genes in COAD patients of the low- and high-risk groups. (C) The number of somatic mutations and neoantigens in low- and high-risk CRC patients from TCGA data set. (D) The expression levels of representative immune checkpoint genes in low- and high-risk CRC patients from TCGA cohort. (E) The TIDE score, T cell dysfunction score, and MSI score in low- and high-risk CRC patients. (F) Comparison of the risk score between distinct immunotherapy responses using the TIDE algorithm in TCGA cohort. R, responder; NR, non-responder. (G) The proportions of CRC patients with response to ICIs in the low- and high-risk categories. R, responder; NR, non-responder. (H) The expression levels of PD-1, PD-L1, and CTLA4 in low- and high-risk patients using IMvigor210 cohort. (I) The proportions of patients with response to PD-L1 blocking immunotherapy in the low- and high-risk categories from IMvigor210 cohort. CR, complete response; PR, partial response; SD, stable disease; PD, progressive disease. (J) Distribution of the risk score in distinct responses to anti-PD-L1 treatment in IMvigor210 cohort. (K) Differences in the risk score among specific tumor immunophenotype using IMvigor210 cohort. (L) The proportion of patients with distinct tumor immunophenotype in the low- and high-risk categories. ***P < 0.001; **P < 0.01; *P < 0.05; ns, not significant.

