
. 2022 May 31;9:909936. doi: 10.3389/fmed.2022.909936
Copyright © 2022 Conti, Izzo, Russillo, Picillo, Amboni, Scaglione, Nicoletti, Cani, Cicero, De Bellis, Charlier, Giudice, Somma, Corbi, Barone, Filippelli and Pellecchia.
This is an open-access article distributed under the terms of the Creative Commons Attribution License (CC BY). The use, distribution or reproduction in other forums is permitted, provided the original author(s) and the copyright owner(s) are credited and that the original publication in this journal is cited, in accordance with accepted academic practice. No use, distribution or reproduction is permitted which does not comply with these terms.
FIGURE 9.
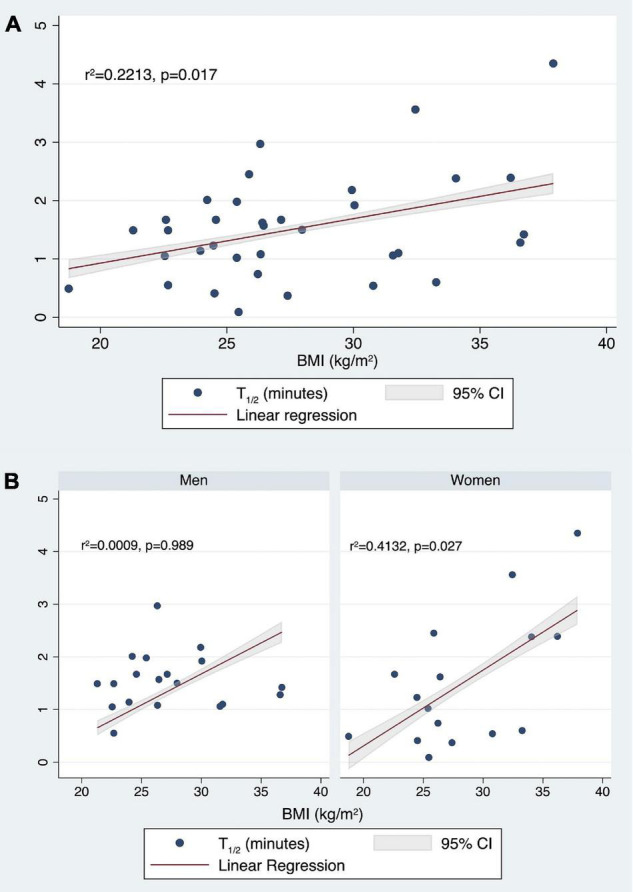
Correlation between t1/2 (min) values and BMI (kg/m2) in the whole population (A) and stratifying by sex (B).