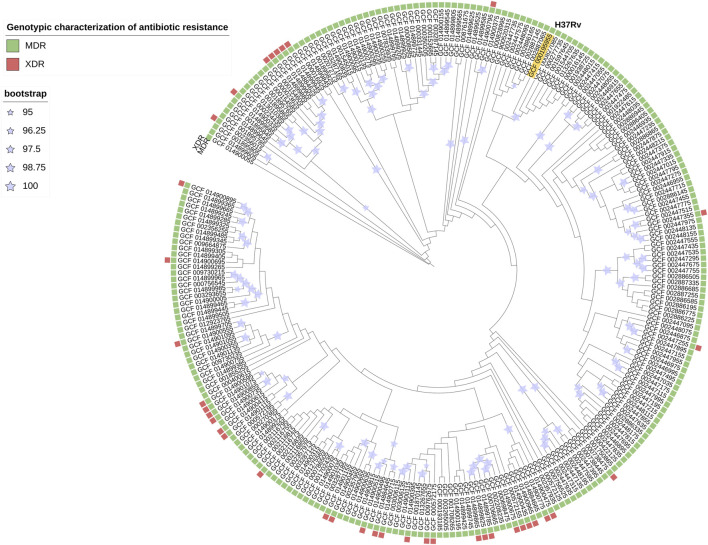
FIGURE 2.
Phylogenetic tree pan-genome Mtb is an iTOL circular visualization with the branch length and the bootstrap values displayed. The tree is based on the Maximum Likelihood topology of 254 strains representative of Mtb diversity and shows that length is proportional to nucleotide topology. Bootstrap values for clades corresponding to the main Mtb clades are shown. The colors correspond to the different genotypic characterizations of antibiotic resistance (MDR = Multidrug Resistant; XDR = Extensively Drug-Resistant).

