FIGURE 3.

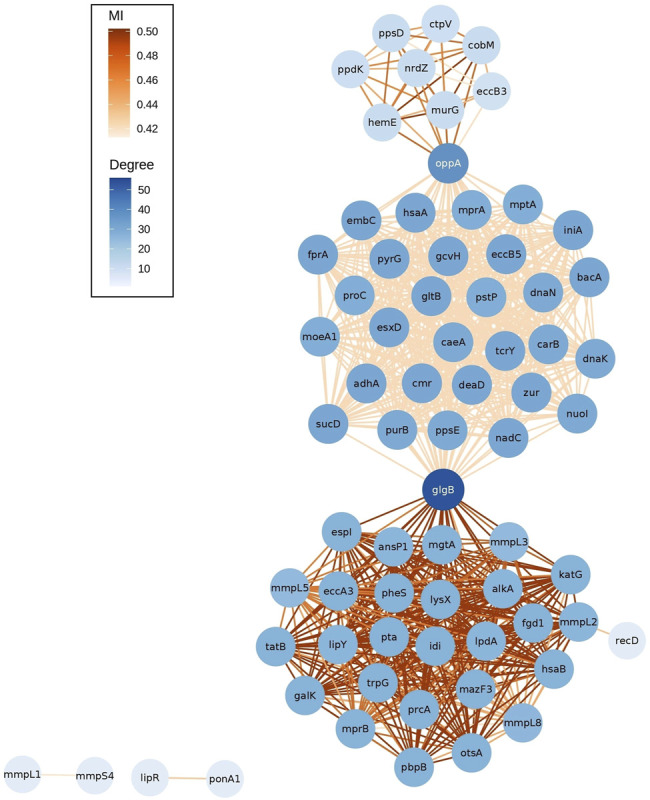
Network of outlier epistatic interactions. The gradient color of nodes depicts the node degree. The gradient color of edges depicts values of MI.

Network of outlier epistatic interactions. The gradient color of nodes depicts the node degree. The gradient color of edges depicts values of MI.