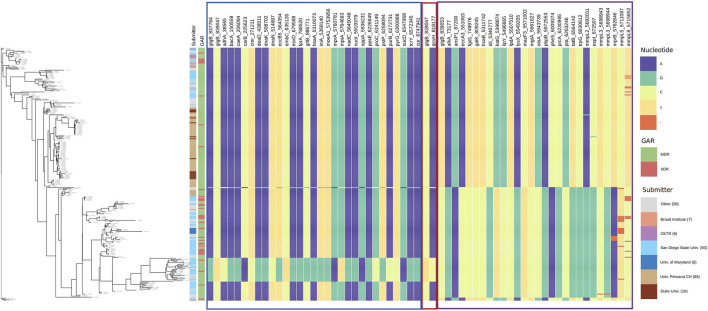
FIGURE 6.
Allele distribution at the loci of genes interacting with glgB. Labels of the column indicate gene name and locus. Estimated phylogeny is included on the left. Interacting loci are organized in sections with borders. The border color corresponds to the color of the sections in Supplementary Data S7. GAR = Genotypic Antibiotic Resistance.

