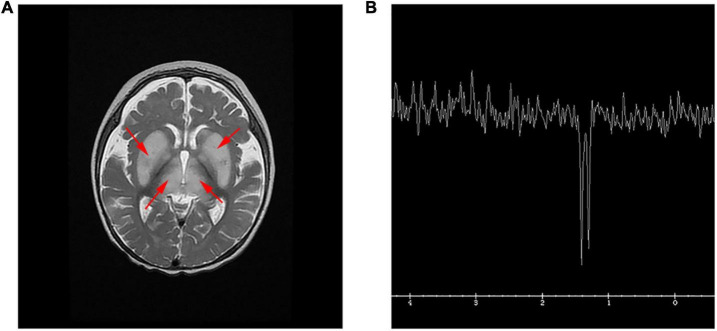
FIGURE 1.
MRI and MRS in the patient. (A) T2 weighted image (T2WI) showed symmetrical hyperintensity in the basal ganglia and thalamus, and a small amount of subdural effusion in the forehead. (B) Single voxel MRS of the left basal ganglia. The lactate peak, clearly visible as an inverted doublet at TE = 144 ms.

