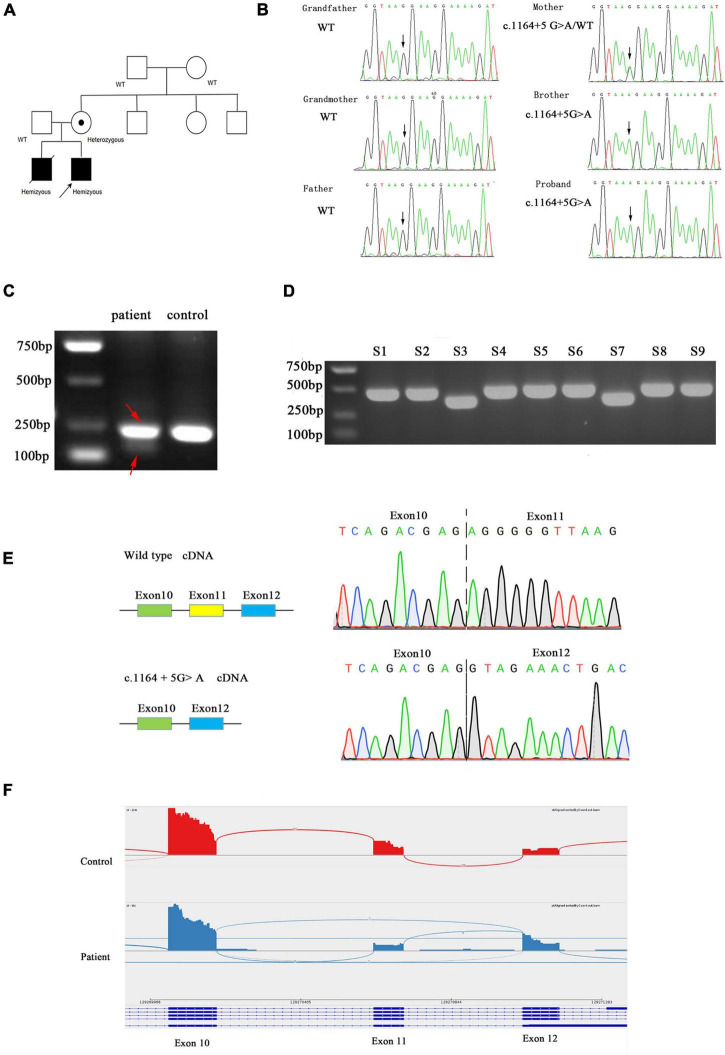
FIGURE 2.
(A) Family pedigree. Black symbols represent affected persons and symbols with a dot, carriers. The proband is indicated by an arrow. (B) Chromatograms for the mutations confirmed by Sanger sequencing. (C) Agarose gel electrophoresis of the transcripts generated by cDNA amplification of the patient and control, with adjacent schematic representation of the resulting splicing events. The PCR product of patient was marked by red arrow. (D) Agarose gel electrophoresis of cloning PCR. S1–S9 represent the different clones picked. (E) Sanger sequencing electropherogram of gel-purified fragments for the upper band and lower band from the patient cDNA samples. (F) AIFM1 Sashimi plot of RNA extracted from patient’s and control’s fibroblasts.

