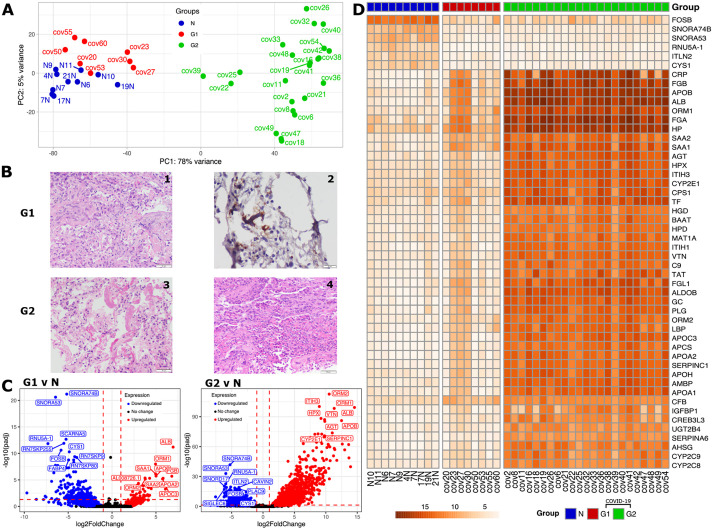
Fig. 2.
Differential expression and histopathological analyses of COVID-19 samples. (A) PCA plot based on gene expression counts across COVID-19 samples and the control group (‘N’, blue) identified two groups of patients, G1 (red) and G2 (green). (B) Representative histological images of postmortem lung tissue sections for the two patient groups. The G1 group (above) displayed acute organizing pneumonia (200× magnification) (1) and microthrombi (CD61 immunostaining, 400× magnification) (2). The G2 group (below), displayed diffuse alveolar damage with hyaline membranes (200× magnification) (3) and acute bronchopneumonia with microabscesses (200× magnification) (4). Scale bars: 50 μm (panels 1,3,4), 20 μm (panel 2). (C) Volcano plot describing the fold changes and false discovery rate (FDR)-adjusted P-values between the two groups of COVID-19 patients versus control samples with downregulated genes in blue and upregulated genes in red. The top ten differentially expressed (DE) gene names are highlighted. The horizontal dashed line indicates the significance cut-off [adjusted P-value (Padj)<0.05; Wald test, corrected for multiple testing using the Benjamini–Hochberg method] and the vertical dashed lines indicate the log2 fold change (l2fc) cutoffs (l2fc>1 and l2fc<−1). (D) Variance-stabilizing transformed (vst) gene expression profile of the top 50 significantly DE genes between control and two groups of COVID-19 patients.

