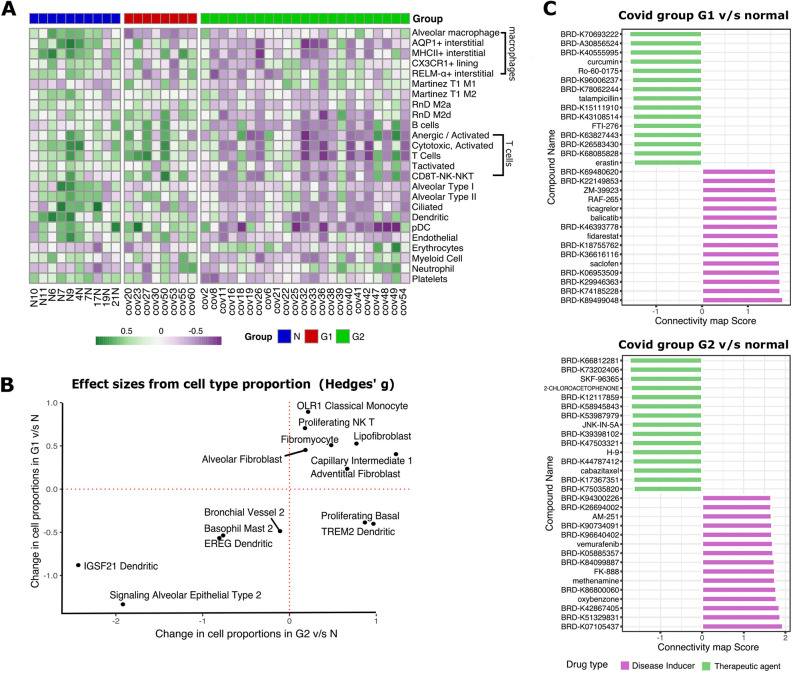
Fig. 4.
Cell-type-specific gene set enrichment and in silico drug screening. (A) Heatmap of GSVA enrichment scores per sample for previously implicated cell types involved in physical organization of lung physiology (Daamen et al., 2021) that are significantly differentially expressed (P<0.05, Wilcoxon test) between normal (‘N’) and either G1 or G2 samples. (B) Changes in effective size of relative cellular proportions in G1 versus N and G2 versus N. Proliferating basal cells and TREM2+ dendritic cells were increased in G2 patients compared to G1. (C) Bar plots of connectivity map (CMap) scores for potential disease inducers (purple) and potential therapeutic compounds (green) for G1 and G2 groups of patients, respectively.

