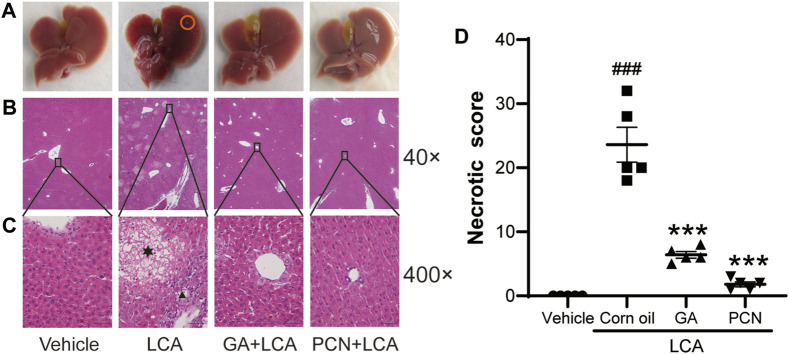
FIGURE 1.
Effects of GA on histopathological changes of hepatic tissues. (A) Gross inspection, bile infarcts are marked by red circles; (B) low magnification (40×); (C) high magnification (400×). Hepatocyte necrosis is marked by asterisks, and portal inflammation cells are marked by arrowheads. (D) Necrotic score of H&E-stained liver sections (low magnification of 40×). Data are shown as mean ± SD (n = 5). #p < 0.05 vs. vehicle group; ∗∗∗ p < 0.001 vs. LCA group.

