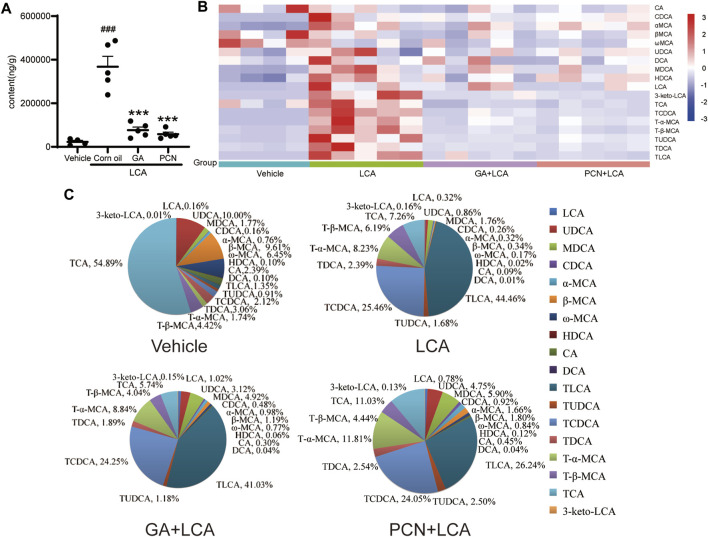
FIGURE 3.
Effect of GA on the BA composition in the liver from LCA-induced model mice. (A) Amount of total detected BAs; (B) heatmap of hepatic individual BAs (blue represents downregulating, and red represents upregulating, compared with the vehicle group); (C) bile acid composition of the hepatic BA pool. Data are expressed as mean ± SD (n = 5). ###p < 0.001 vs. vehicle group; ∗∗∗ p < 0.001 vs. LCA group.

