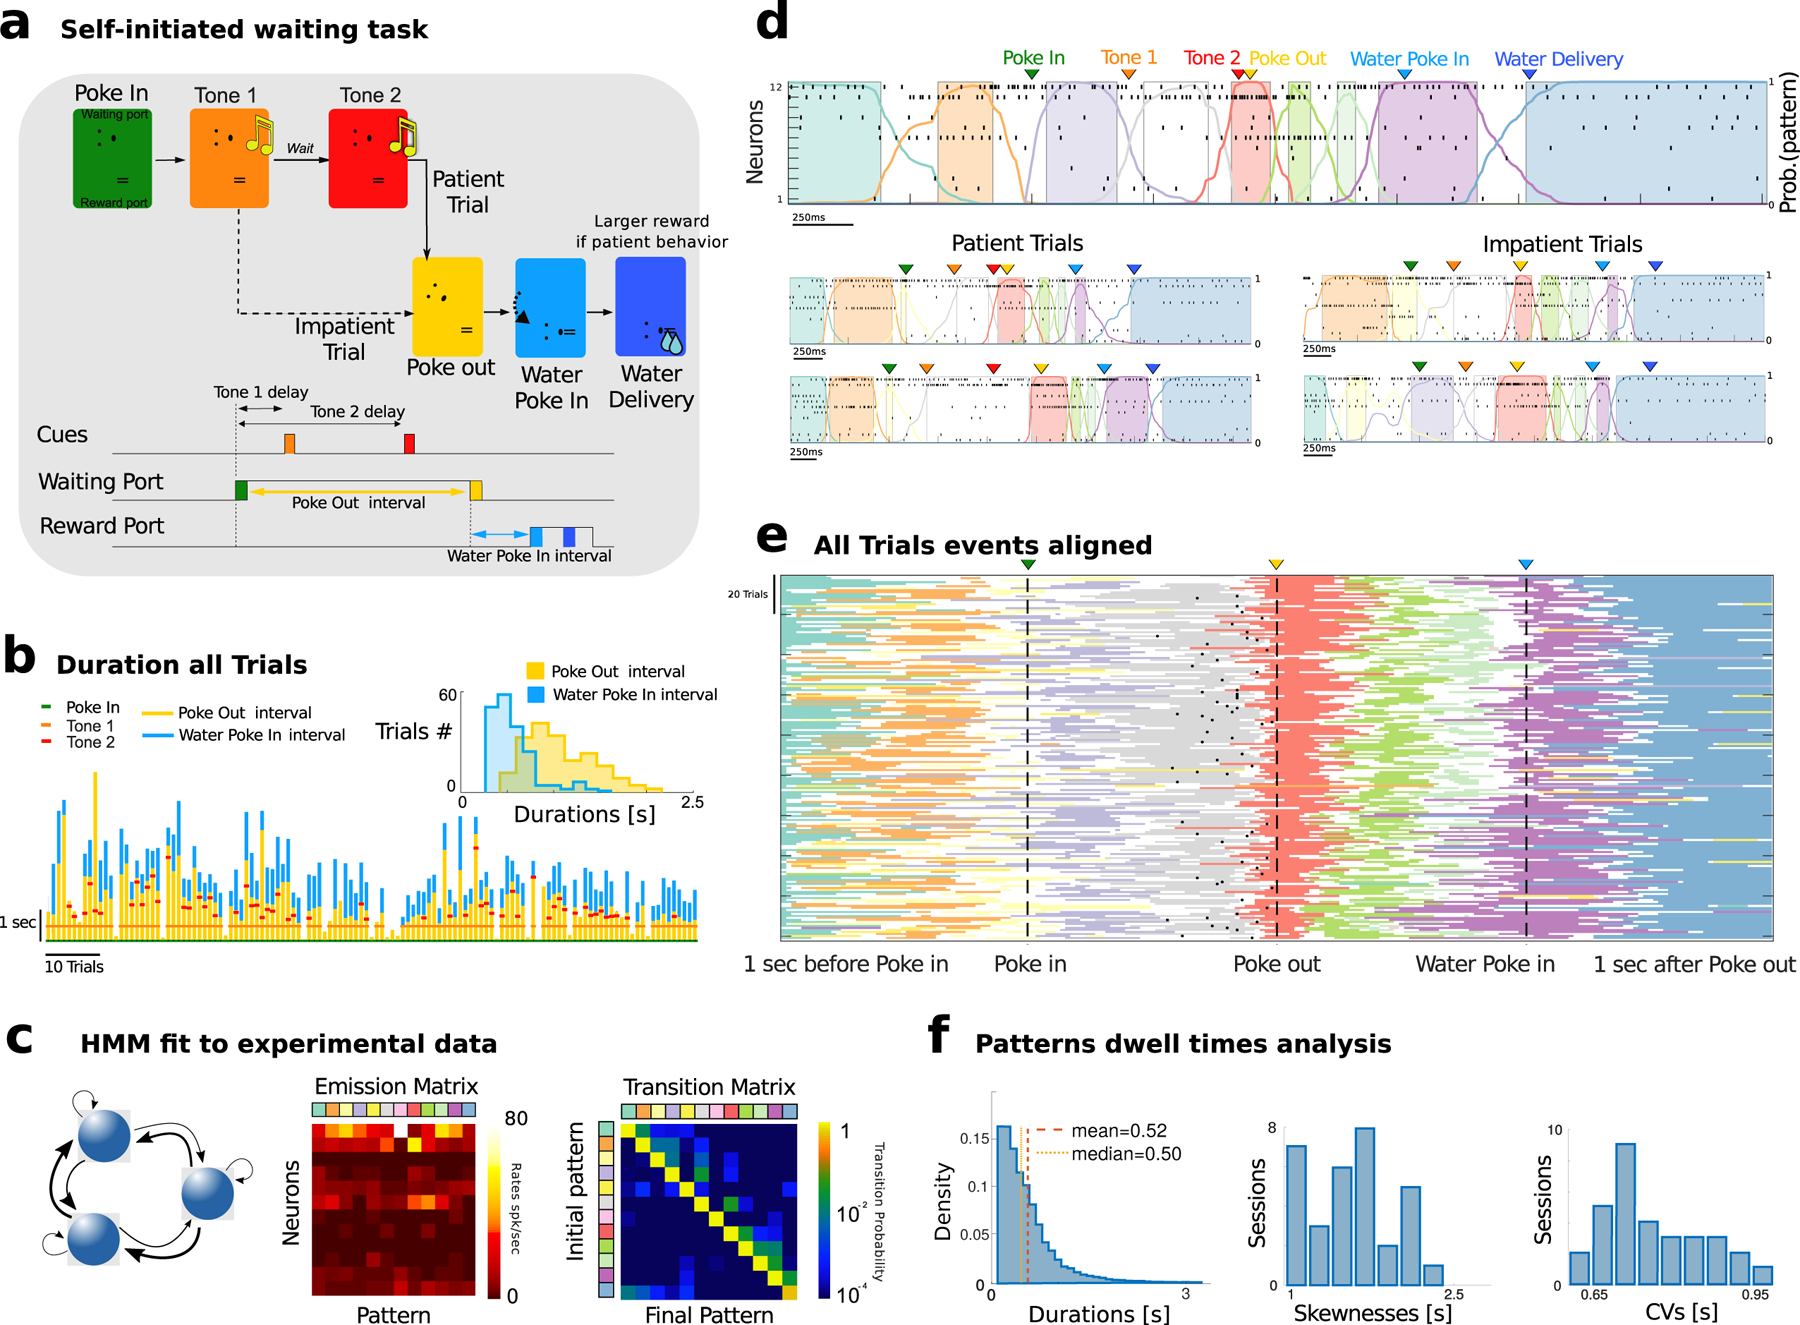
Figure 1: Waiting task and M2 pattern sequences.

a) Schematic of task events. A rat self-initiated the waiting task by poking into a Wait port (Poke In), where tone 1 was played (after 400 ms), and, after a variable delay, a different tone 2 was played. The animal could decide to Poke Out of the Wait port at any time (after tone 2 in patient trials; between tone 1 and 2 in impatient trials) and move to the Reward port (Water Poke In) to receive a water reward (large and small for patient and impatient trials, respectively). Bottom: schedule of trial events. Three events (PI, PO, WPI) are triggered by self-initiated actions with respective interevents interval highlighted. b) Waiting behavior in a representative session. Tick marks represent event times (see legend). Vertical bars indicate waiting times for Poke Out and Water Poke In (yellow and cyan, respectively). When the red tick (second Tone) is not present, that marks an impatient trial. Inset: Interevent interval distribution for self-initiated actions ([PO - PI] and [WPI - PO], yellow and cyan, respectively). c) Neural pattern inference via Hidden Markov Model (HMM). An HMM (left, schematics) is fit to a representative session in d, returning a set of neural patterns (Emission Matrix, center) and a Transition Probability Matrix (TPM, right). Each pattern is a population firing rate vector (columns in the Emission Matrix). The TPM returns the probability for a transition between two patterns to occur. d) Representative trials from one ensemble of 12 simultaneously recorded M2 neurons during patient (top and bottom left) and impatient (bottom right) trials. Top: spike rasters with latent patterns extracted via HMM (colored curves represent pattern posterior probability; colored areas indicate intervals where a pattern was detected with probability exceeding 80%). e) All trials from the representative session (each row corresponds to a trial). Individual trials have been time-stretched to align to five different events (1 s before Poke In, Poke In, Poke Out, Water Poke In, 1s after Poke Out). All trials display a stereotyped pattern sequence. Color-coded lines represent stretched intervals where patterns were detected (same as colored intervals in d). Black tick marks represent tone 2 onset in patient trials only, while impatient trials are displayed but tone 2 is not reported. f) Left: Histogram of pattern dwell times for all patterns across all trials in the representative session reveal right-skewed distributions (we excluded the first and last pattern in the sequence, whose duration artificially depends on trial interval segmentation). Skewness and coefficient of variability (CV) of pattern dwell time distributions reveal large trial-to-trial variability (33 sessions).
