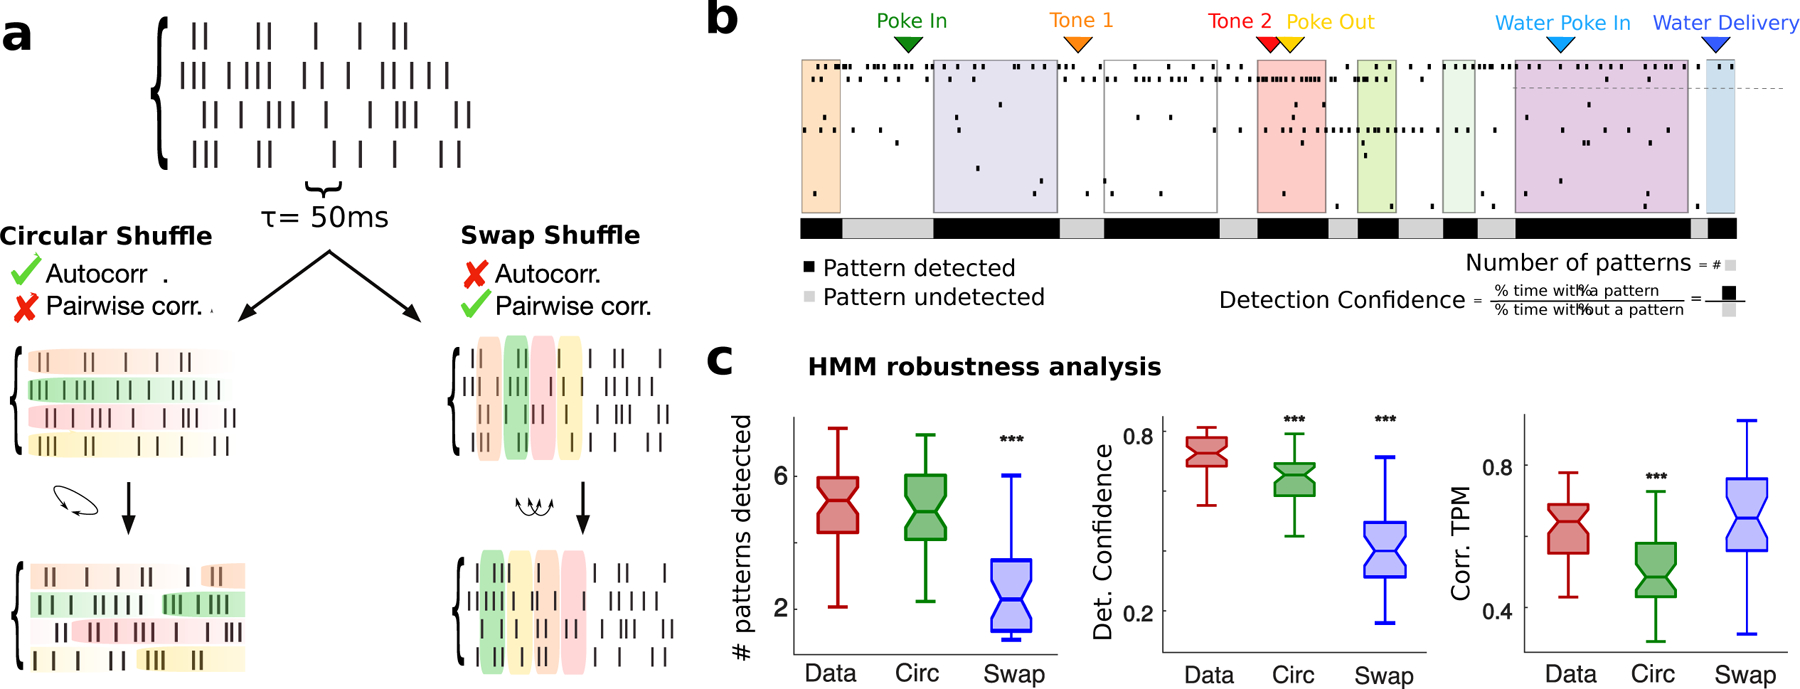
Figure 2: Robustness of pattern inference.

a) Schematic of shuffled procedure to create surrogate datasets: Circular Shuffle (left) preserved single-cell autocorrelations and destroyed pairwise correlations; Swap Shuffle (right) preserved pairwise correlations and destroyed autocorrelations. c) Representative trial showing detection confidence measure (same color-coded notation as in Fig. 1; black and grey bars: fraction of trial duration where patterns were detected with probability larger or smaller than 80%, respectively. d) HMM robustness analyses. Left: Average number of patterns in each trial for empirical and surrogate datasets. Center: Pattern detection confidence, estimated as fraction of time across all trials where patterns were detected with probability exceeding 80%. Right: Consistence of pattern sequence, estimated as Pearson correlation coefficients between single-trial estimates of “symbolic” TPMs encoding the sequence identity (see Methods methods:comparison). b-d: signed-rank tests between empirical and shuffled datasets, * = p < 0.05, ** = p < 0.01, *** = p < 0.001.
