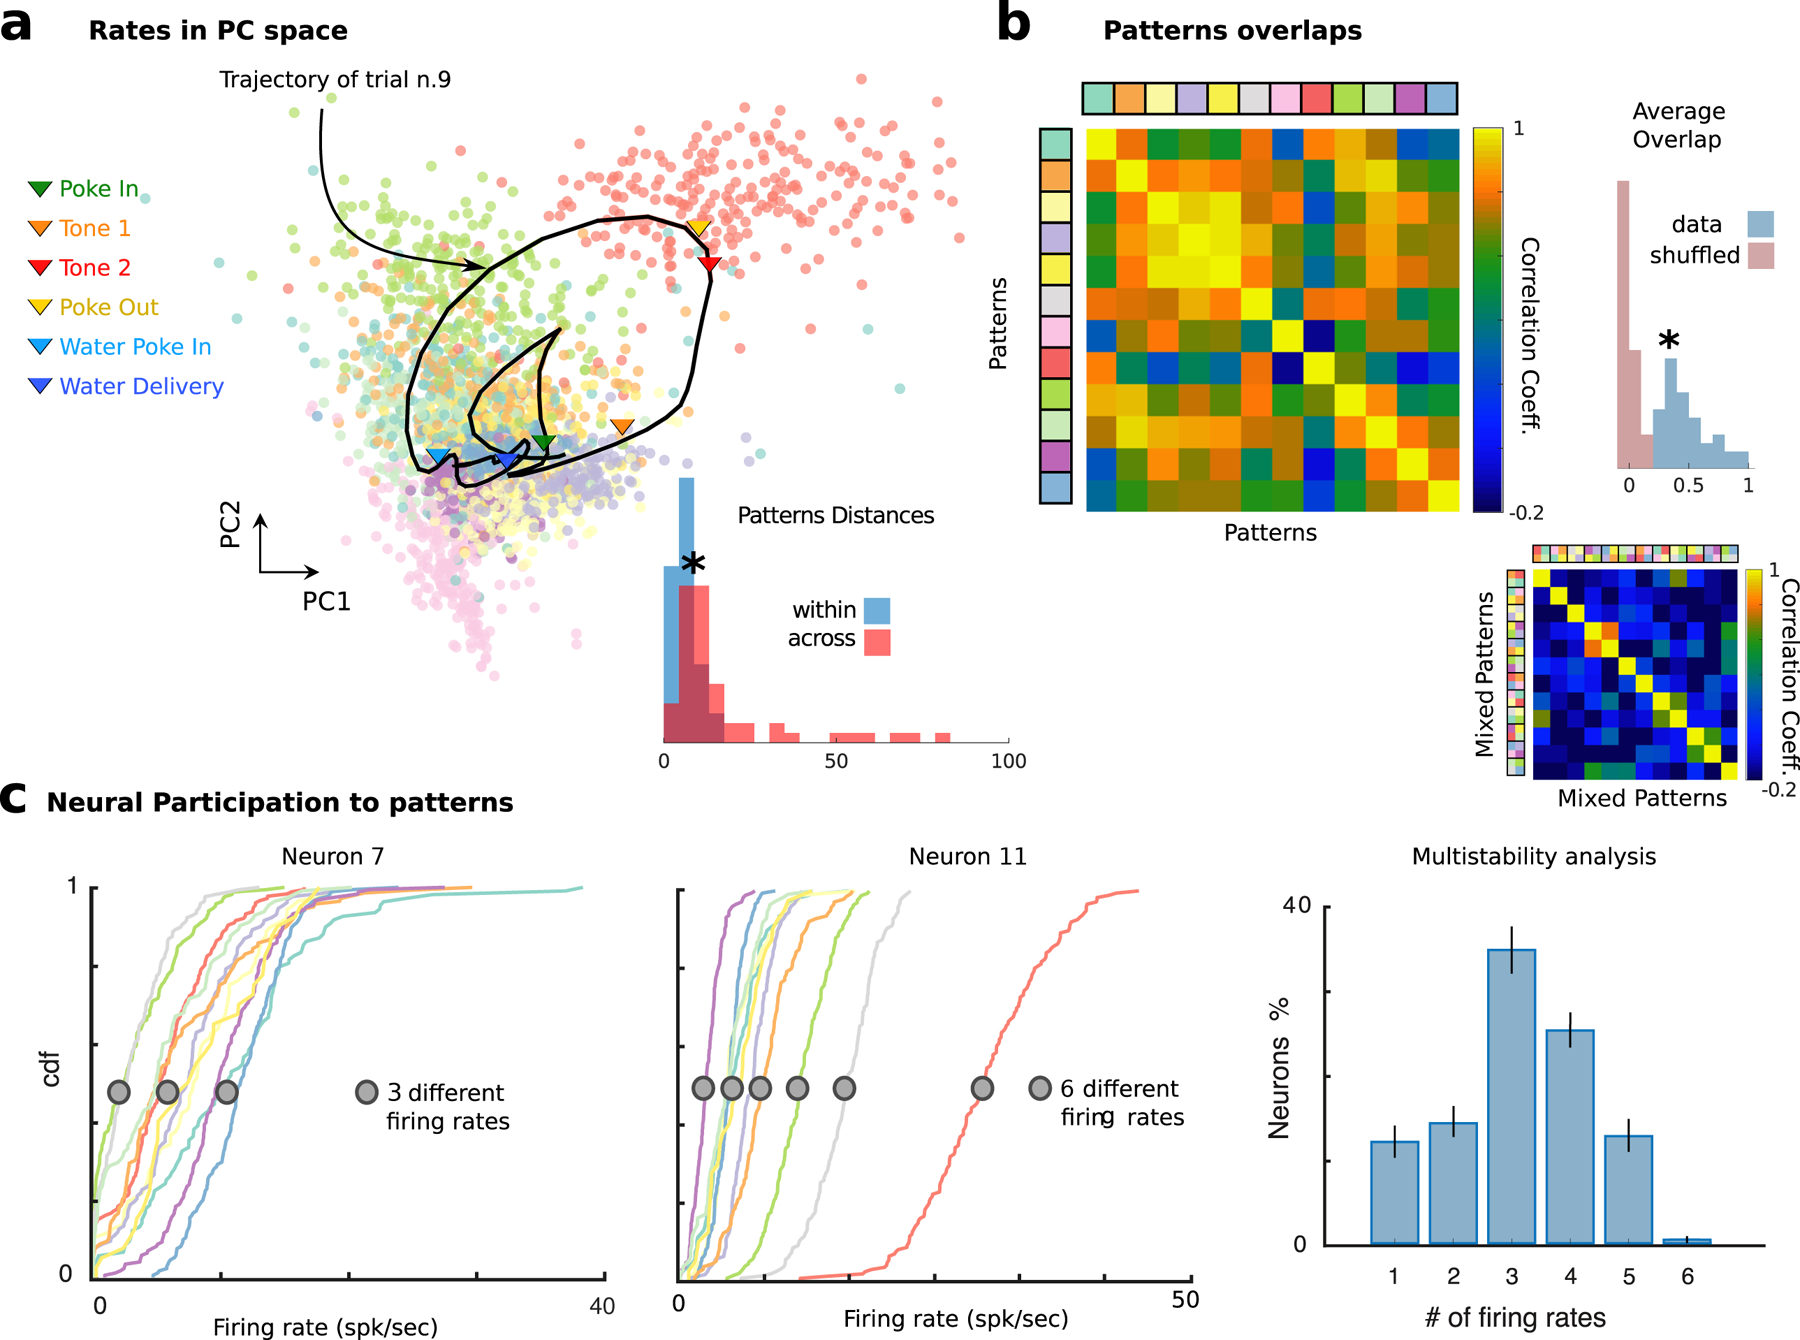
Figure 3: Dense and distributed population code in M2.

a) Neural patterns cluster in Principal Component space (all trials from the representative session in Fig. 1; color-coded dots represent patterns in single trials; one representative trial smoothed trajectory obtained by averaging neural activity in a sliding window of 600ms; arrows show events onsets along trajectory). Inset: Distribution of within- and across-cluster distances between patterns (ranksum test p < 2.0 × 10⁻⁷). Colors of different patterns are consistent with previous and following figures where the same example session is analyzed. b) Pearson correlation matrix between patterns reveals significantly larger overlaps in the empirical data (top left: representative session) compared to those found when drawing random patterns from the empirical firing rate distribution (bottom right). In this case the average firing rate of individual neurons in each pattern and trial was randomly drawn from the firing rate distribution of all neurons across all patterns in the same trial. Inset: Distribution of pattern correlations for empirical (blue) versus shuffled datasets (red). c) Single neuron firing rates are modulated by pattern sequences. Left: Cumulative firing rate distributions conditioned on patterns (color-coded as a) and Fig. 1d) for two neurons from the representative ensemble, revealing 3 and 6 significantly different firing rates across patterns, respectively (see Methods sec. 3.4 and Fig. S2i). Right: Number of different firing rates per neuron revealed multistable dynamics where 87 ± 2% of neurons had activities modulated by patterns.
