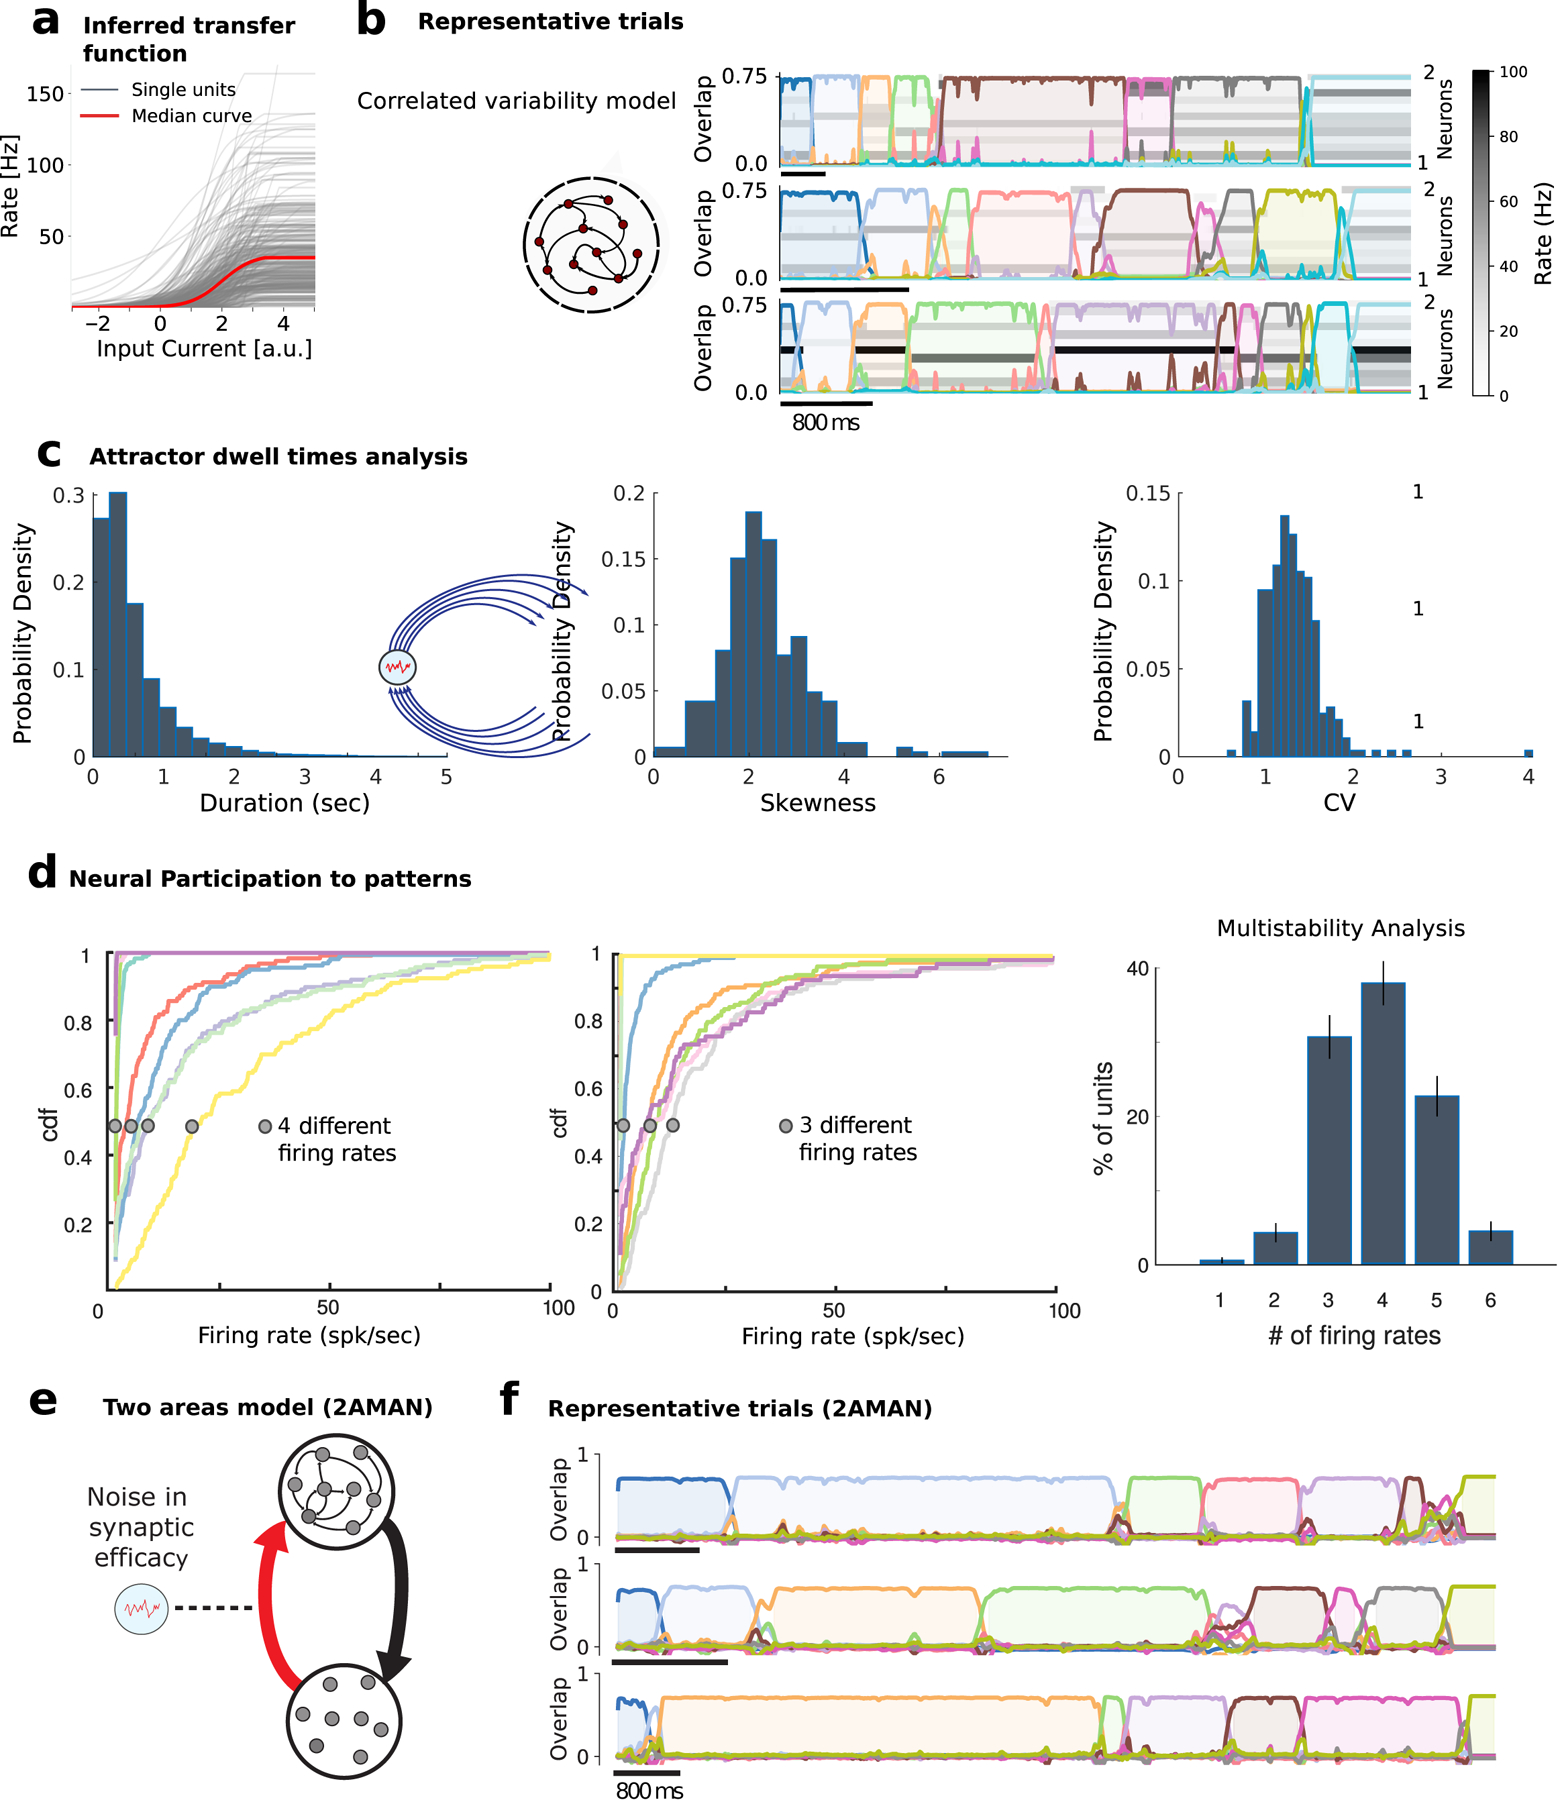
Figure 5: Attractor model of pattern sequences.

a) Distribution of empirical single-cell current-to-rate transfer functions ϕi inferred from the data (328 neurons from 33 sessions), used as transfer functions in the recurrent network model (see Methods). b) The correlated variability model Sec. 2.6 generates reliable sequences of long-lived attractors with large trial-to-trial variability in attractor dwell times (representative trials: rows represent the activity of 12 neurons randomly sampled from the network; color-coded curves represent time course of overlaps (see Eq. (3.10)) between population activity and each attractor; detected attractors are color-shaded). c) Histogram of attractor dwell times across trials in the representative network of b) reveals right-skewed distributions (left, we excluded the first and last pattern in the sequence, whose duration artificially depends on trial interval segmentation). Skewness (center) and coefficient of variability (CV, right) of pattern dwell time distributions reveal large trial-to-trial variability (33 simulated networks). The same plots, generated by means of states individuated in the model via a HMM fit on the model simulated neural traces, are shown in Fig. S9a. d) Single neuron firing rates are modulated by pattern sequences in the model. Cumulative firing rate distributions conditioned on attractors (color-coded as in b)) for two representative neurons in the model, revealing 2 and 3 significantly different firing rates across attractors, respectively (see Methods Sec. 3.4). Inset: Number of different firing rates per neuron revealed multistable dynamics where 99 ±1% of neurons had activities modulated by patterns. c) Two-area model schematic. Fluctuations in the synaptic efficacy depend only on the pre-synaptic terminals at area Y (see Eq. (3.15)), and therefore on the fluctuations on the synaptic efficacy of the Y→M2 synapses. d) Three example trials of the two-area model dynamics. As our analytical calculations predict, it produces meta-stable attractor dynamics that quantitatively match our phenomenological model and the data (dwell times distribution not shown). Parameters are the same as in Table 1. The additional parameters take values NY = 1000, AY←M2 = 0.12, and AM2←Y = 1. Area Y’s input-output transfer function is the rectifier linear function ϕ(x) = [x –1]+.
