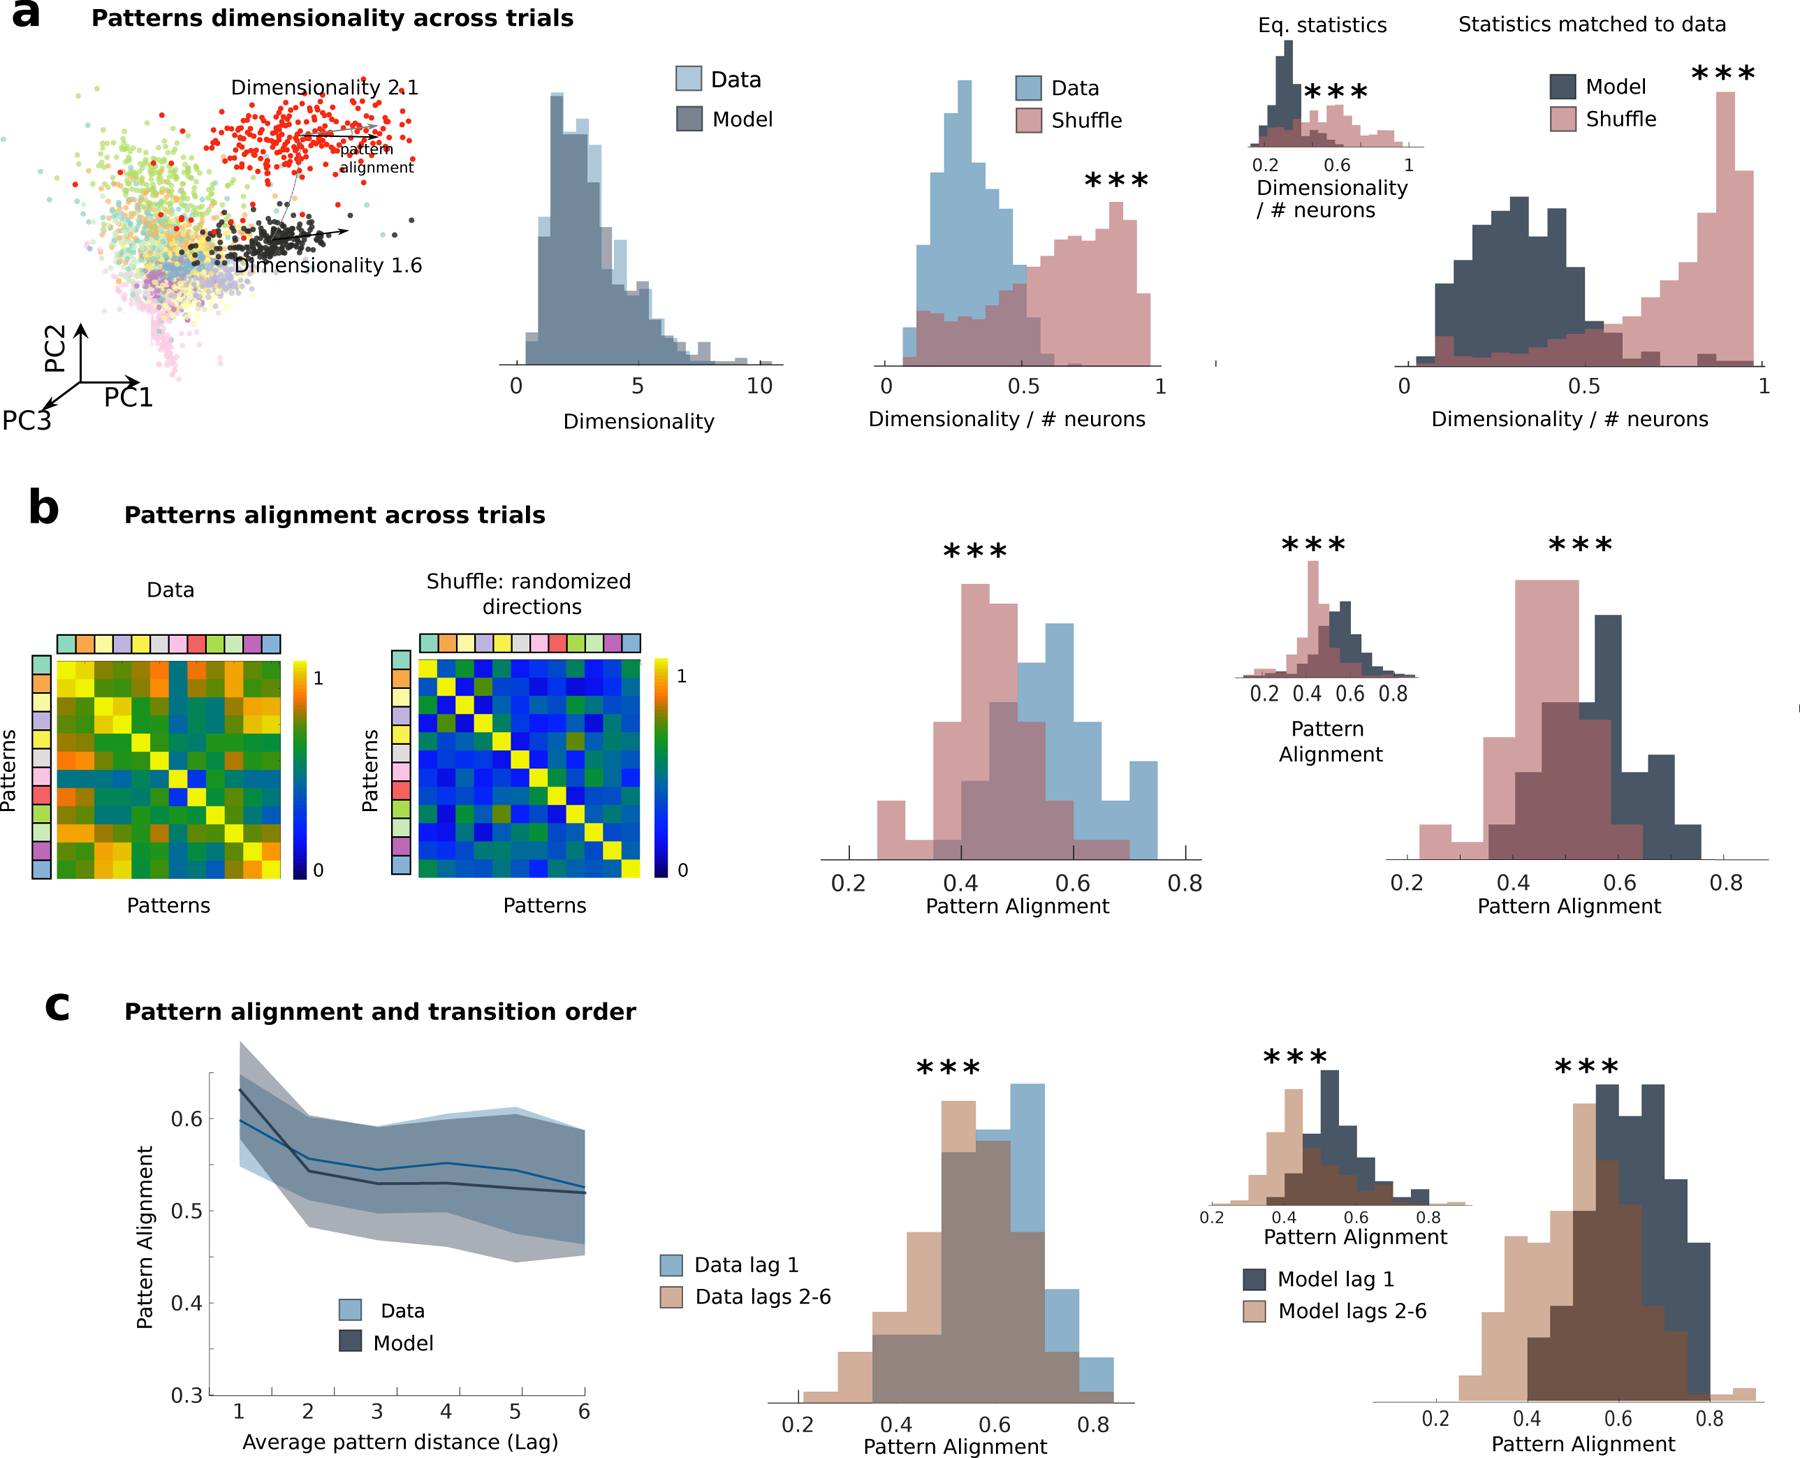
Figure 6: Low-dimensional variability in models and data.

a) Comparison of dimensionality of pattern-conditioned noise correlations in the data (blue) and the model (grey) reveals low-dimensional population activity fluctuations, significantly smaller than expected by chance (red, shuffled datasets). In the shuffle dataset the firing rate of each neuron in each state and trial was randomly sampled from the the empirical distributions of firing rates for all states and trials in the same session. From left to right: first panel, representative session as in Fig. 1); second panel, summary across 33 sessions from the data and the model; third panel, fractional dimensionality in the data; fourth panel: model dimensionality estimated by matching ensemble sizes and number trials to data across 33 simulated sessions; inset: dimensionality estimated from N=10000 neurons in 33 simulated sessions. b) Pattern-conditioned noise correlations are highly aligned between patterns in the data. Alignment between top canonical correlation vectors (blue, data; gray, model) is larger than between random principal component directions (red). c) Left: Alignment of noise correlations between each pattern and patterns occurring at lag n in the sequence (e.g., n =1 represents patterns immediately preceding or following the reference pattern) in the model (grey) and in the data (blue). Pattern alignments are significantly larger for patterns at one lag compared to patterns at longer lags. All panels: * = p < 0.05, *** = p < 0.001. The same plots in panels a-c, generated by means of states individuated in the model via a HMM fit on the model’s simulated neural traces, are shown in Figs. S9b to S9d.
