Figure 2.
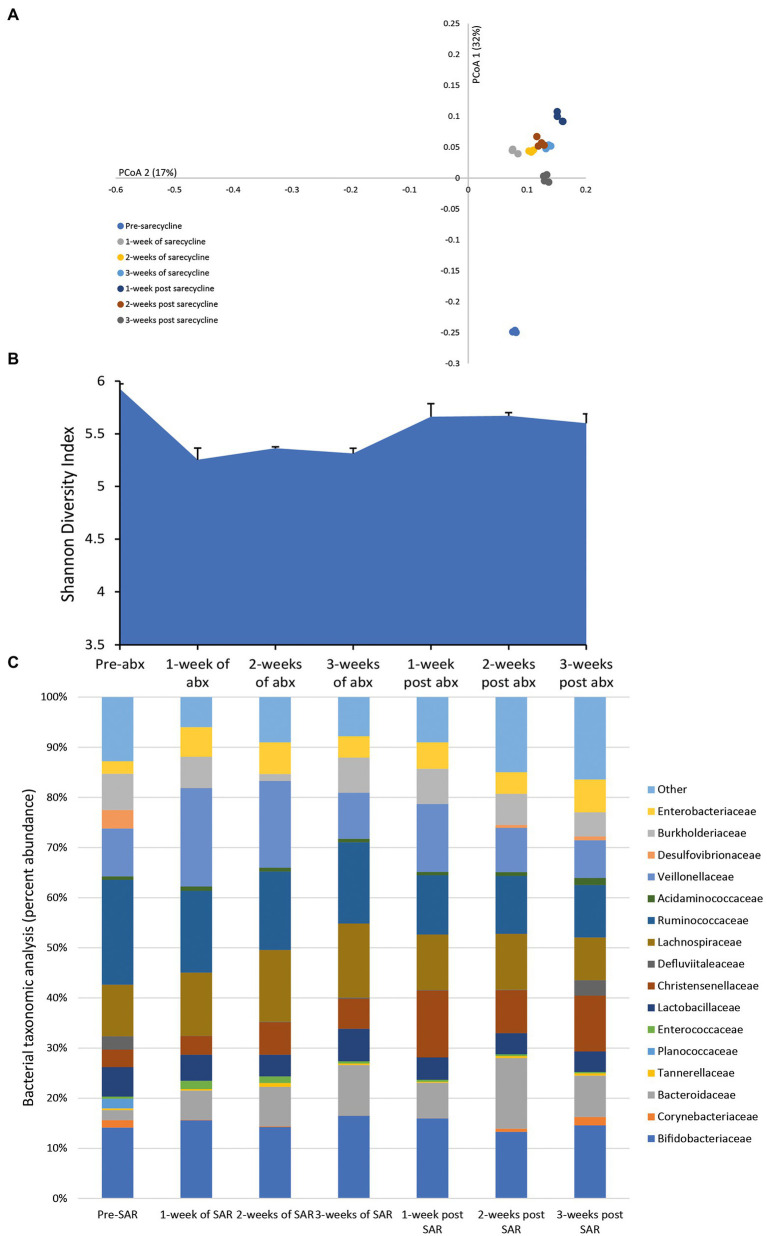
Effect of sarecycline on the human microbiota. Changes to the microbiota profile during each week of sarecycline instillation and the recovery phase shown as a Principal Coordinate Analysis plot (A). Results shown are four technical replicates. Changes in the microbial diversity after exposure to sarecycline and the recovery phase, as measured by the Shannon diversity index from four technical replicates (B). Bacterial taxonomic abundance changes in response to sarecycline instillation (C). Stacked bar graphs are mean percent abundance, from four technical replicates, analyzed from 16S rRNA sequencing.

