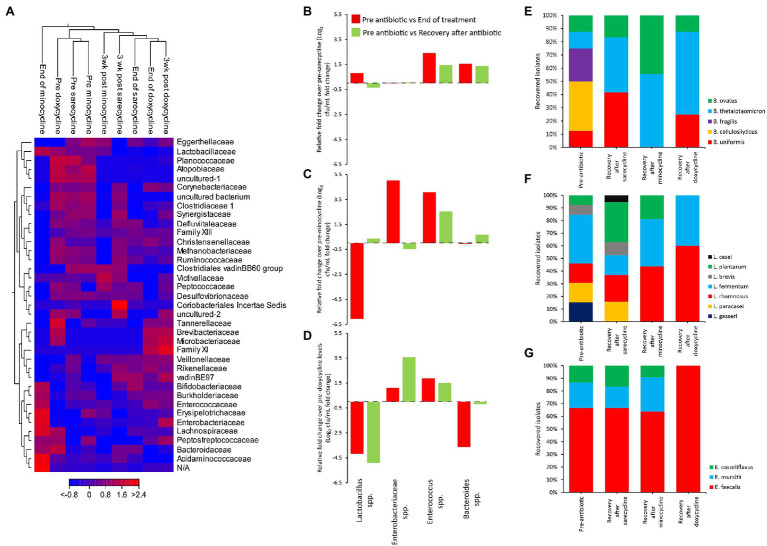
Figure 5.
Comparative analysis of the effect of antibiotics on the human microbiota. Heat map comparing the microbial abundance before antibiotic administration, at the end of antibiotic, and at the end of the recovery phase (A). Fold change in bacterial recoveries at the end of antibiotics (red bars) and at the end of recovery phase (green bars) compared with pre-antibiotic levels, for sarecycline (B), minocycline (C), and doxycycline (D). Fold change levels calculated from microbial enumeration on selective agars shown in Supplementary Figure S2. Bacteroides (E), Lactobacillus (F), and Enterococcus (G) species diversity from selective agar plates before antibiotics and at the end of recovery phase. Approximately 20 colonies from each agar type, for each model, at each time point were identified by MALDI-TOF.

