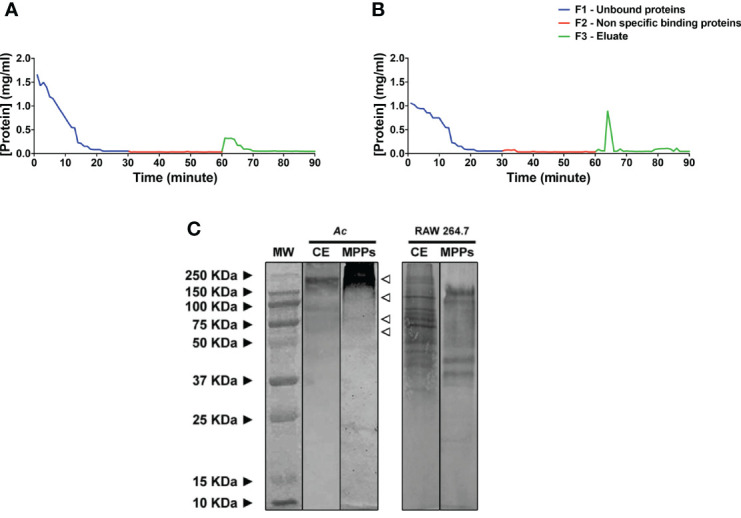
Figure 1.

Differences between the profile composition of mannose-binding lectins on the surface of Acanthamoeba castellanii and macrophages. (A, B) Affinity chromatography with D-mannose agarose columns displaying the chromatogram results upon purification of surface extracts of (A) A. castellanii (Ac) and (B) RAW 264.7 macrophages. (C) Western blot, corresponding to clarified and (MPPs, of Ac and macrophages. The molecular weight standard was used in the analysis. Lane MW: Molecular Weight Standard (Prestained™ Standards, Kleidoscope™); Lane Ac CE: Clarified extract of Ac; Line Ac MPPs: MPPs of Ac, with open arrows indicating the molecular weight of approximately 55 KDa, 75 KDa, 110 KDa and above 150 KDa; Lane RAW 246.7 CE: Clarified extract of RAW 246.7 macrophages; Lane RAW 246.7 MPPs: MPPs of RAW 246.7 macrophages where nine bands were identified, ranging from 37 KDa to 150 KDa.
