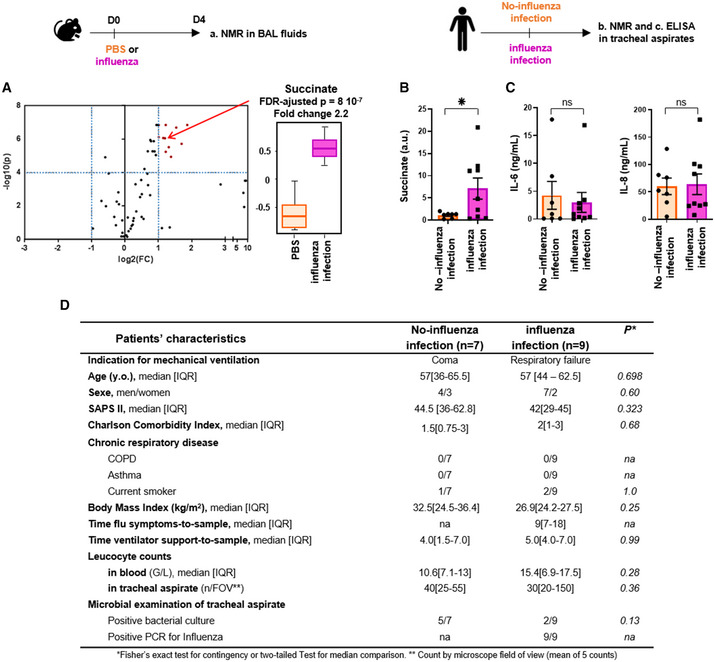
Figure 1. Influenza virus infection increases succinate levels in airways.

- C57Bl/6 mice were infected (n = 9) or not (n = 8) intranasally with 150 pfu of influenza A virus (IAV; A/Scotland/20/74 (H3N2)). Bronchoalveolar lavage fluids (BALs) were collected 4 days postinfection. Samples were further processed for metabolomic analysis by NMR. Left panel shows a volcano‐plot representing the comparison of “IAV‐infected” versus “control, non‐infected” animals. The graph plots the −log (P‐value) against the fold change (log2 (ratio)) for individual metabolites. Vertical dashed blue lines mark the two‐fold change and horizontal dashed blue line marks the cut‐off P‐value of 0.0001. Metabolites in the upper right square in red are significantly more abundant in “IAV‐infected” compared to “control, non‐infected” samples. Succinate (annotated by a red arrow) is one of these compounds with a FC = 2.2 and a FDR‐adjusted P‐value = 8 × 10⁻⁷. The boxplots whiskers correspond to the minimum and maximum values, while the central band is the mean. The first and third quartiles (boxes) are merely the average values between the median and the extrema.
- Shows succinate quantification by NMR from tracheal aspirates collected in mechanically ventilated patients with (pink bar, n = 9) or without (orange bar, n = 7) diagnostic of IAV pneumonia. *P < 0.05.
- IL‐6 and IL‐8 measurements by ELISA from these same tracheal aspirates.
- Main baseline characteristics of the patients included in the study.
Data information: Data are mean ± SEM and statistical analysis was performed using the Mann–Whitney U‐test.
