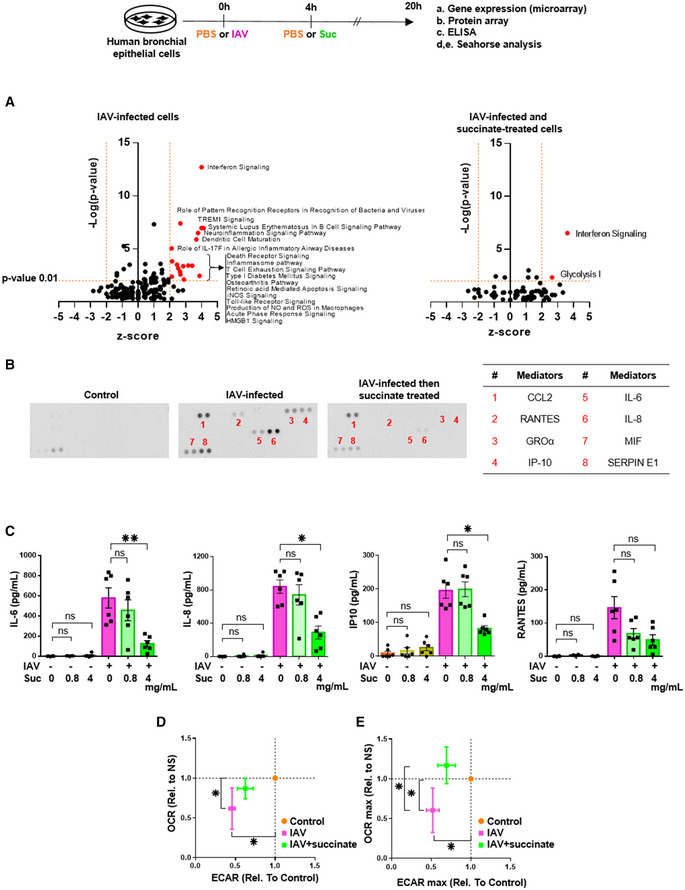
Bronchial epithelial (BEAS‐2B) cells were infected or not with influenza A/Scotland/20/74 (H3N2) virus (IAV) at MOI = 1 for 4 h and treated or not with succinate (Suc; 4 mg/ml/24.7 mM) for 20 h.
-
A
Volcano‐plot showing the most significantly regulated canonical pathways determined by microarray analysis compared with mock‐treated cells. Each dot represents a specific canonical pathway as determined by GSEA. Pathway representations result from the magnitude of regulation (z‐score, x‐axis) and significance (−log10 adjusted P‐value, y‐axis). The dashed horizontal line indicates the statistical significance threshold (P ≤ 0.01 after adjustment with the Bonferroni correction). The two vertical dashed lines show the z‐score threshold (−2: repressed; 2: induced). Colored spots characterize the most highly regulated canonical pathways endowed with statistical significance.
-
B
Representative inflammatory protein‐array blots obtained from the supernatants of control‐ or IAV‐infected‐ or IAV‐infected and succinate‐treated cells. The table on the right side indicates the 8 most regulated mediators by succinate.
-
C
Quantification by ELISA of IL‐6, IL‐8, IP‐10, and RANTES in the supernatants of cells infected or not by IAV and treated or not with succinate.
-
D, E
Panels show the basal replotted ECAR and OCR (D), and glycolytic capacity (ECAR max) and maximal respiration (OCR max) (E) in cells infected with IAV and treated (green symbols) or not (pink symbols) with succinate. Data were normalized with respect to mock‐infected, untreated cells (orange symbols), and were also normalized for DNA content.
Data information: Data are the mean ± SEM of 6 (panel C) or 4 (panels A, D, E) independent experiments. Statistical analysis was performed using the Kruskal–Wallis test with Dunn’s post‐test (C, D, E) (*
P < 0.05 and **
P < 0.01) and ANOVA with Holm–Sidak’s posttest (A).

